My role
As a Product designer, I was responsible for the design and UX of Beverage Analytics. New features and new design patterns, from research to prototyping and release. I oversee production specs and facilitate design reviews with stakeholders I collaborate closely with product managers, developers, researchers, and the marketing team.
UX Design
Information Architecture Wireframes Animated Prototyping
Interface Design
IOS & Android app design Dashboard Design Illustrations
Credits
Shiran Sela – Product Designer
Customer insight & ideation
I partnered with two project managers and the Commercial Director to uncover insights and translate concepts into features that address customer behaviors and motivations.
Planning & scope definition
I defined the product with my project manager partners. I found customer goals and balanced business goals. I prioritized and negotiated features for launch and beyond.
Research
I backed up my decisions with facts and interviews of professional and relevant people such as Marketing, Operation, Architecture, and salespeople who work in the field.
Detailed specs
Sets of documentation during this project helped to communicate requirements to the engineering team and support our quality assurance teams in writing test cases.
These deliverables consisted of requirements, customer journeys, and the Visual Design Spec. This documentation required the most rework during the project and was the highest overhead to maintain.
I also experimented and came up with complementary documentation to communicate animation and timing keyframes for our micro‐interactions.
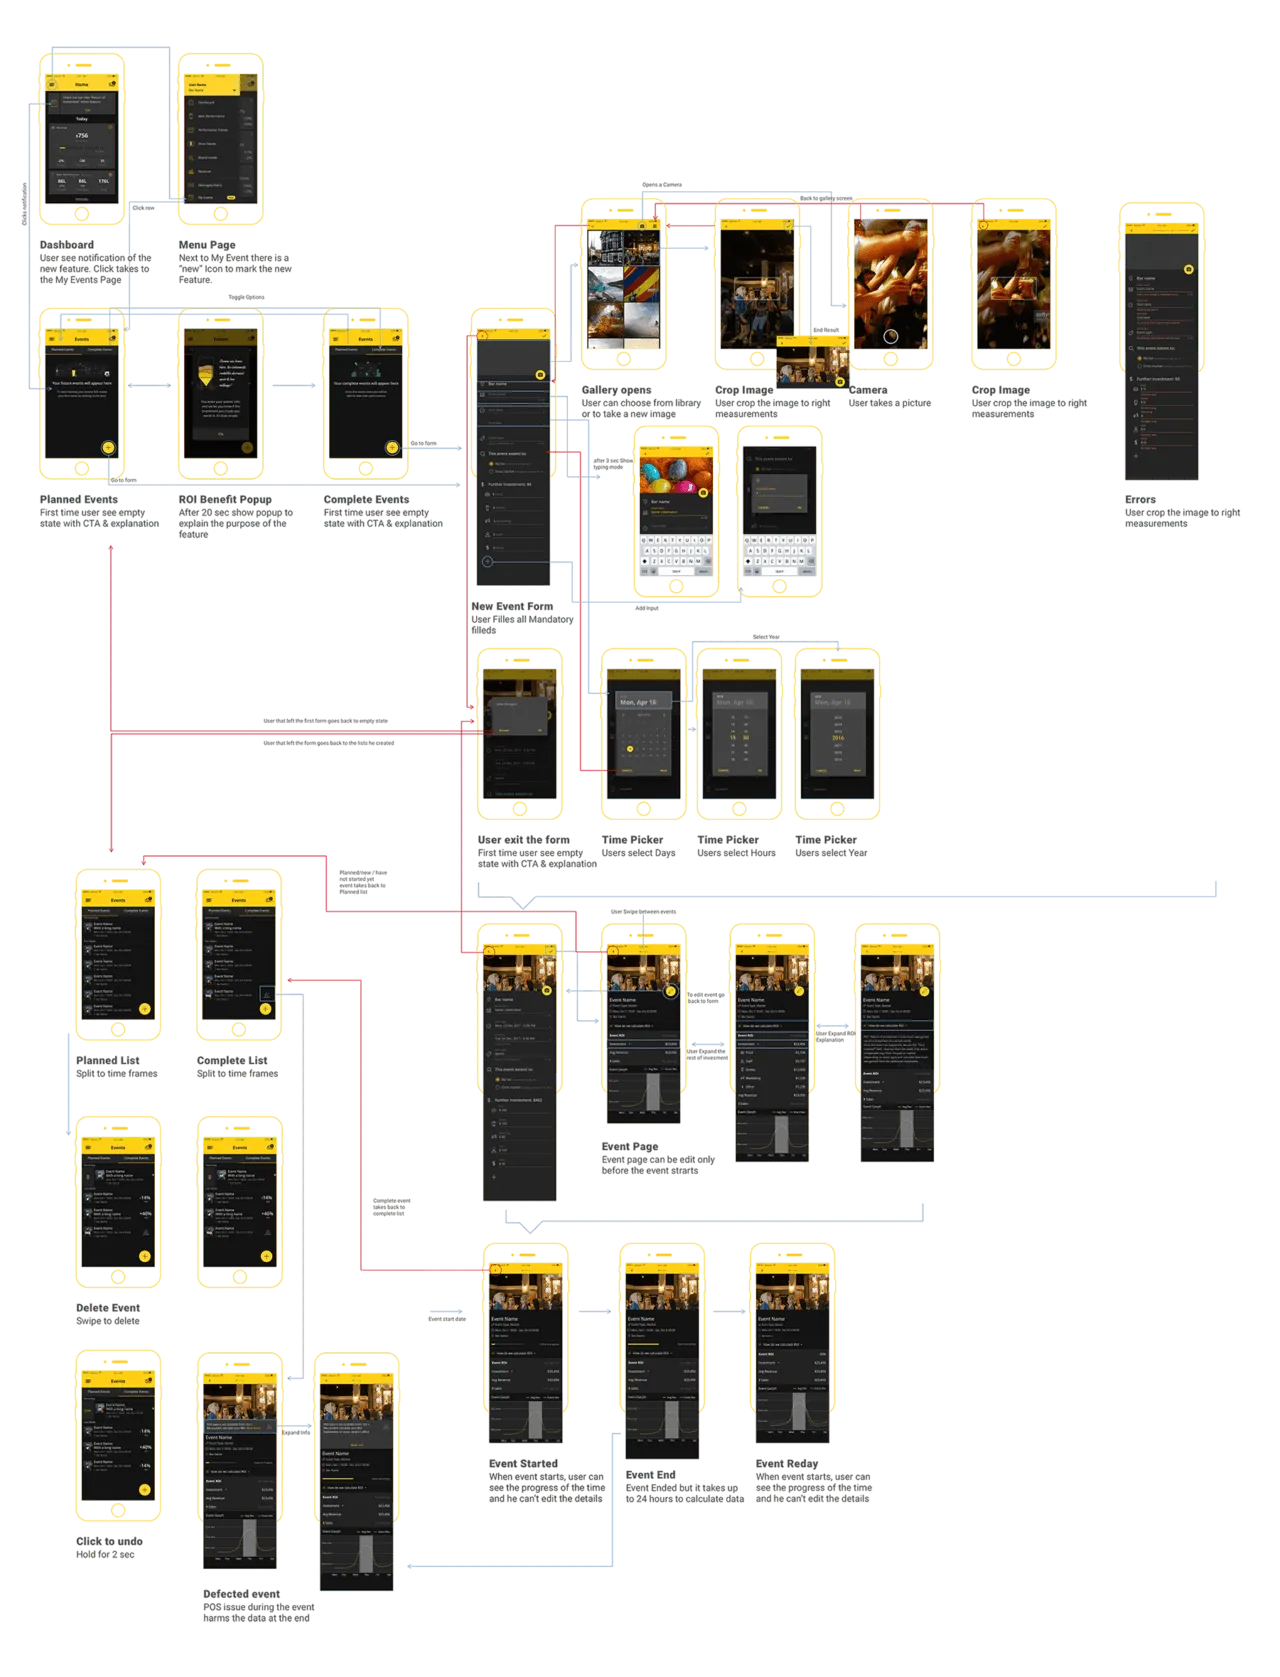
Selected screens
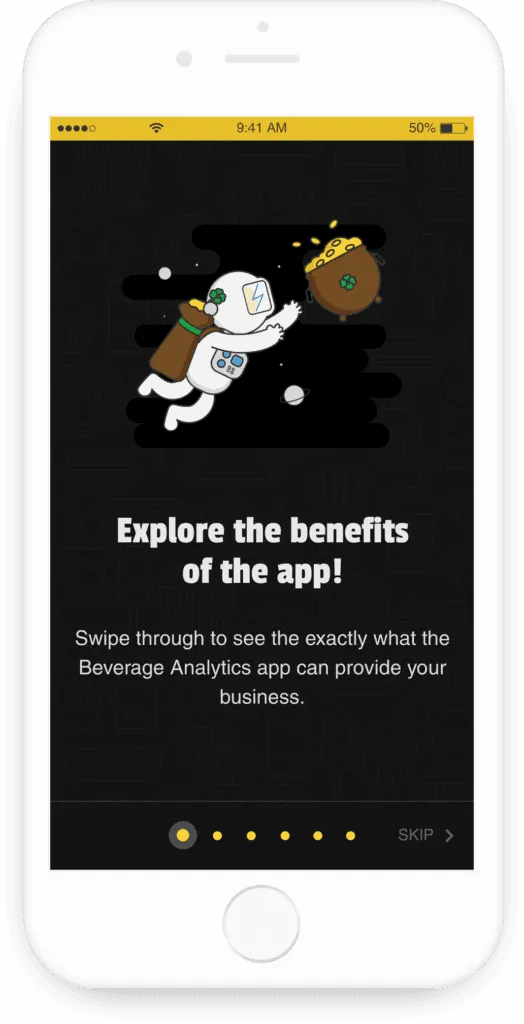
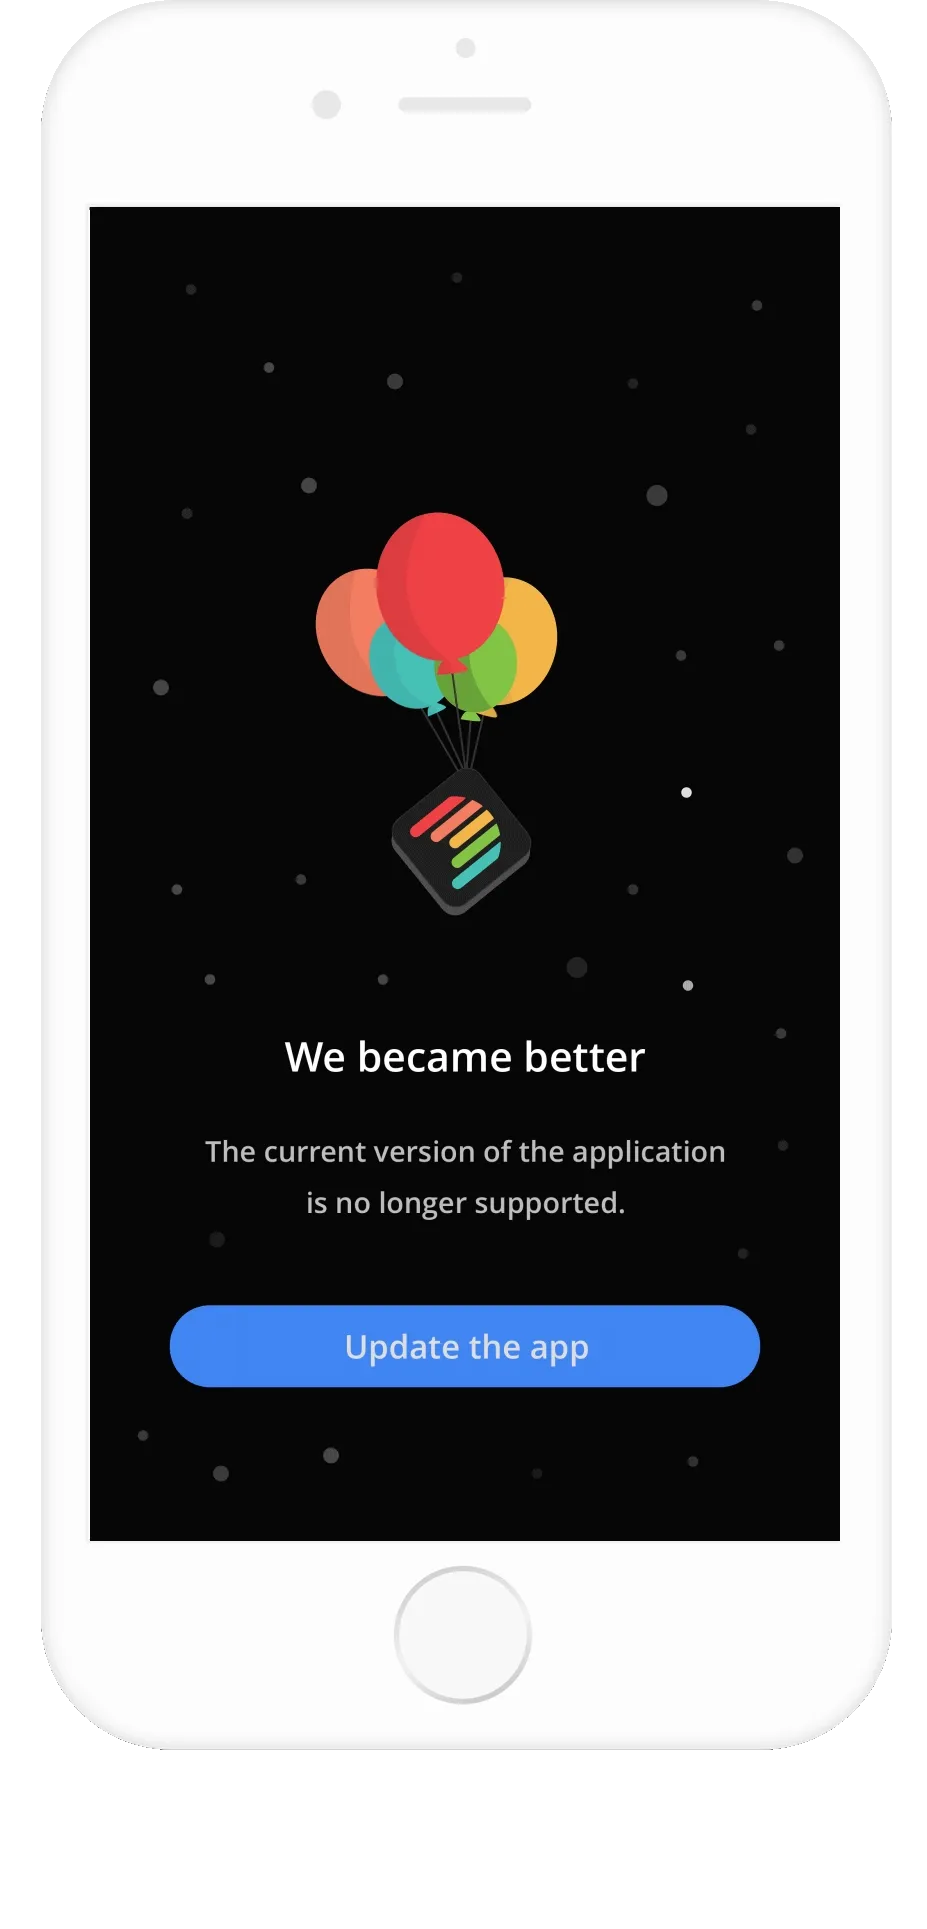
Before the onboarding process starts, showing the benefits and value of the app
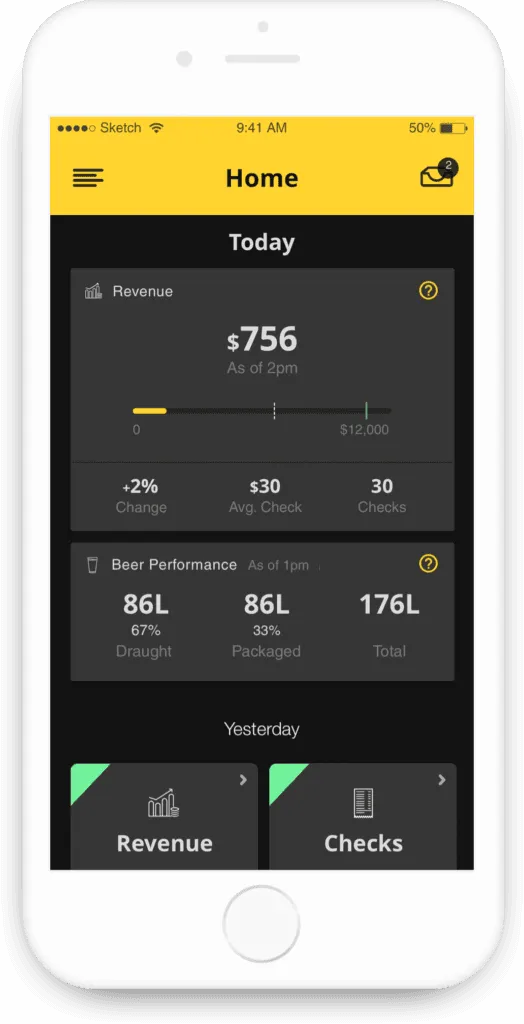
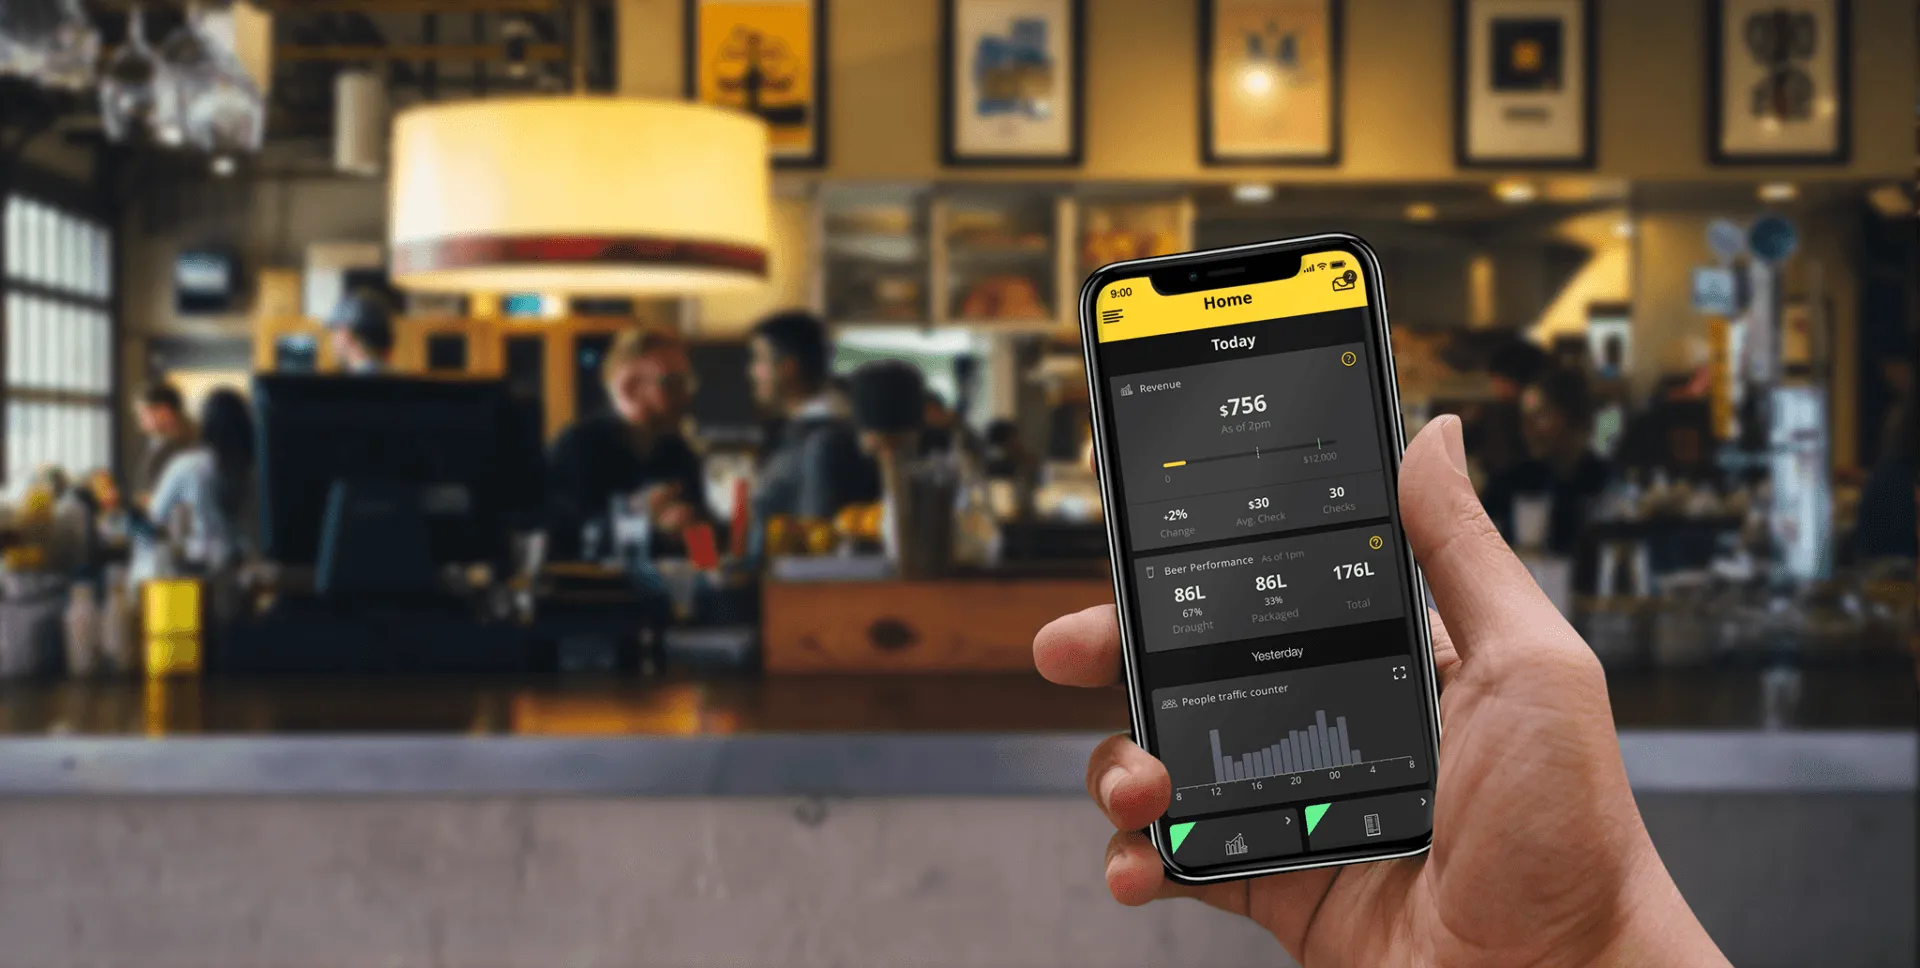
This page presents quick information about the business state
This screen elaborates the relation between the beer that was sold to the poured beer
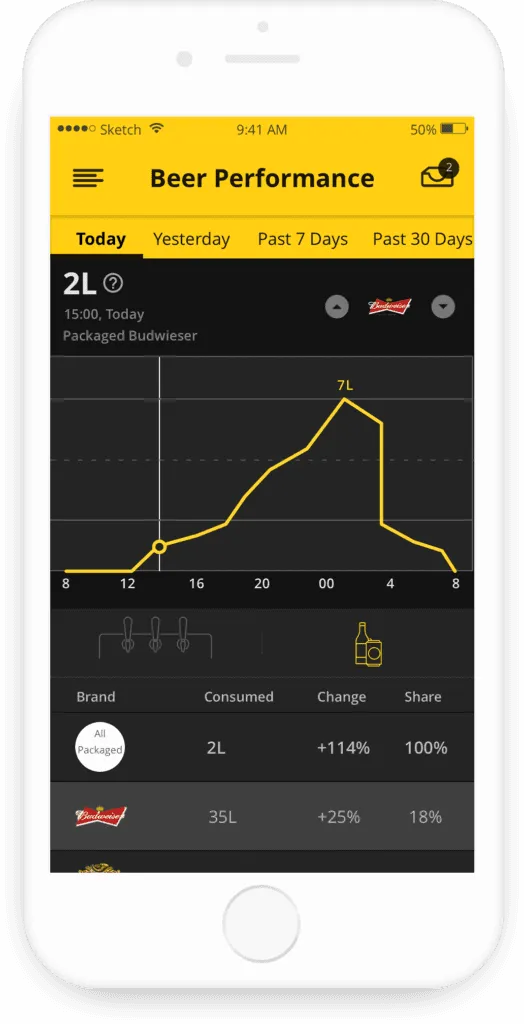
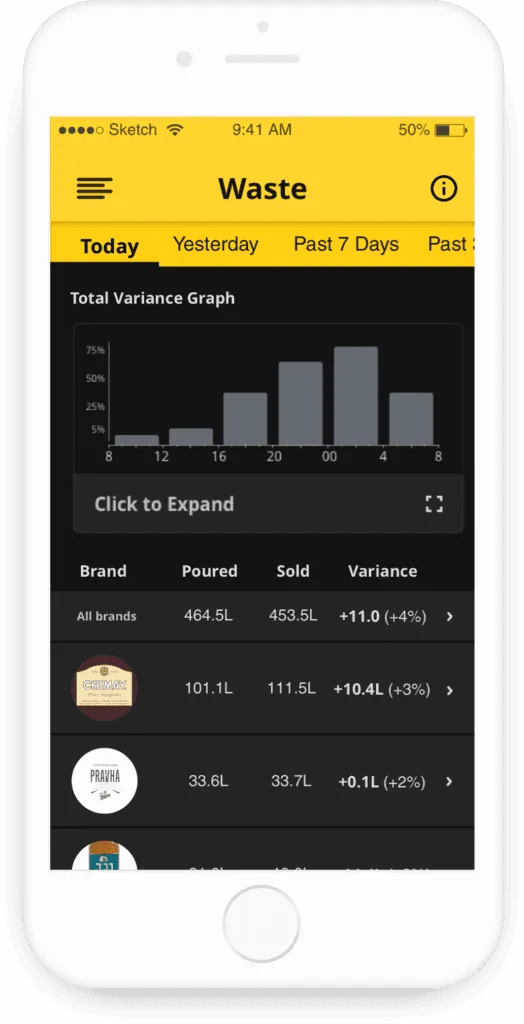
This screen shows how each beer (draft or packaged) got sold in different time scopes
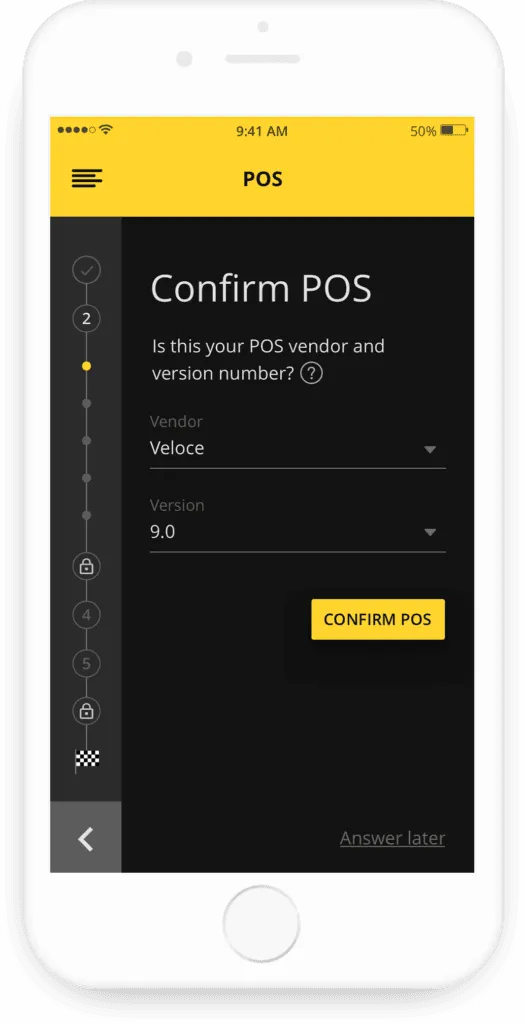
When integrating with a new bar, a part of the process was to confirm the correct POS vendor and version
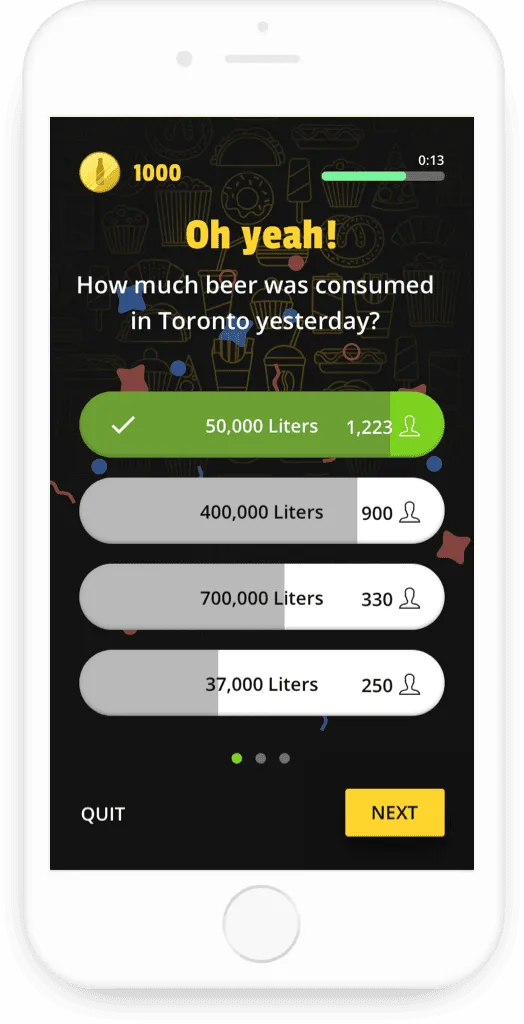
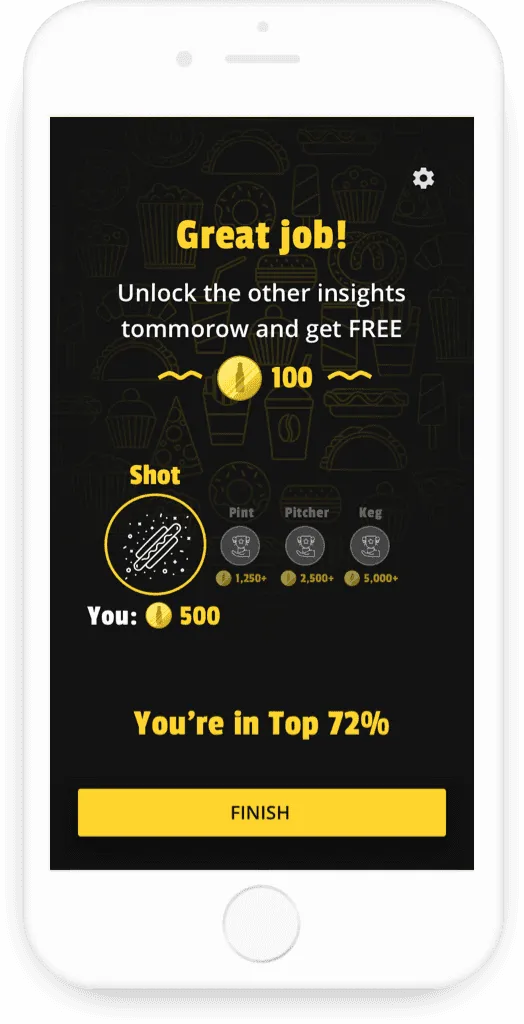
The quiz goal is to make the user interact while waiting and show the app data knowledge about the market
Sets of documentation to communicate requirements to engineering and support QA test cases
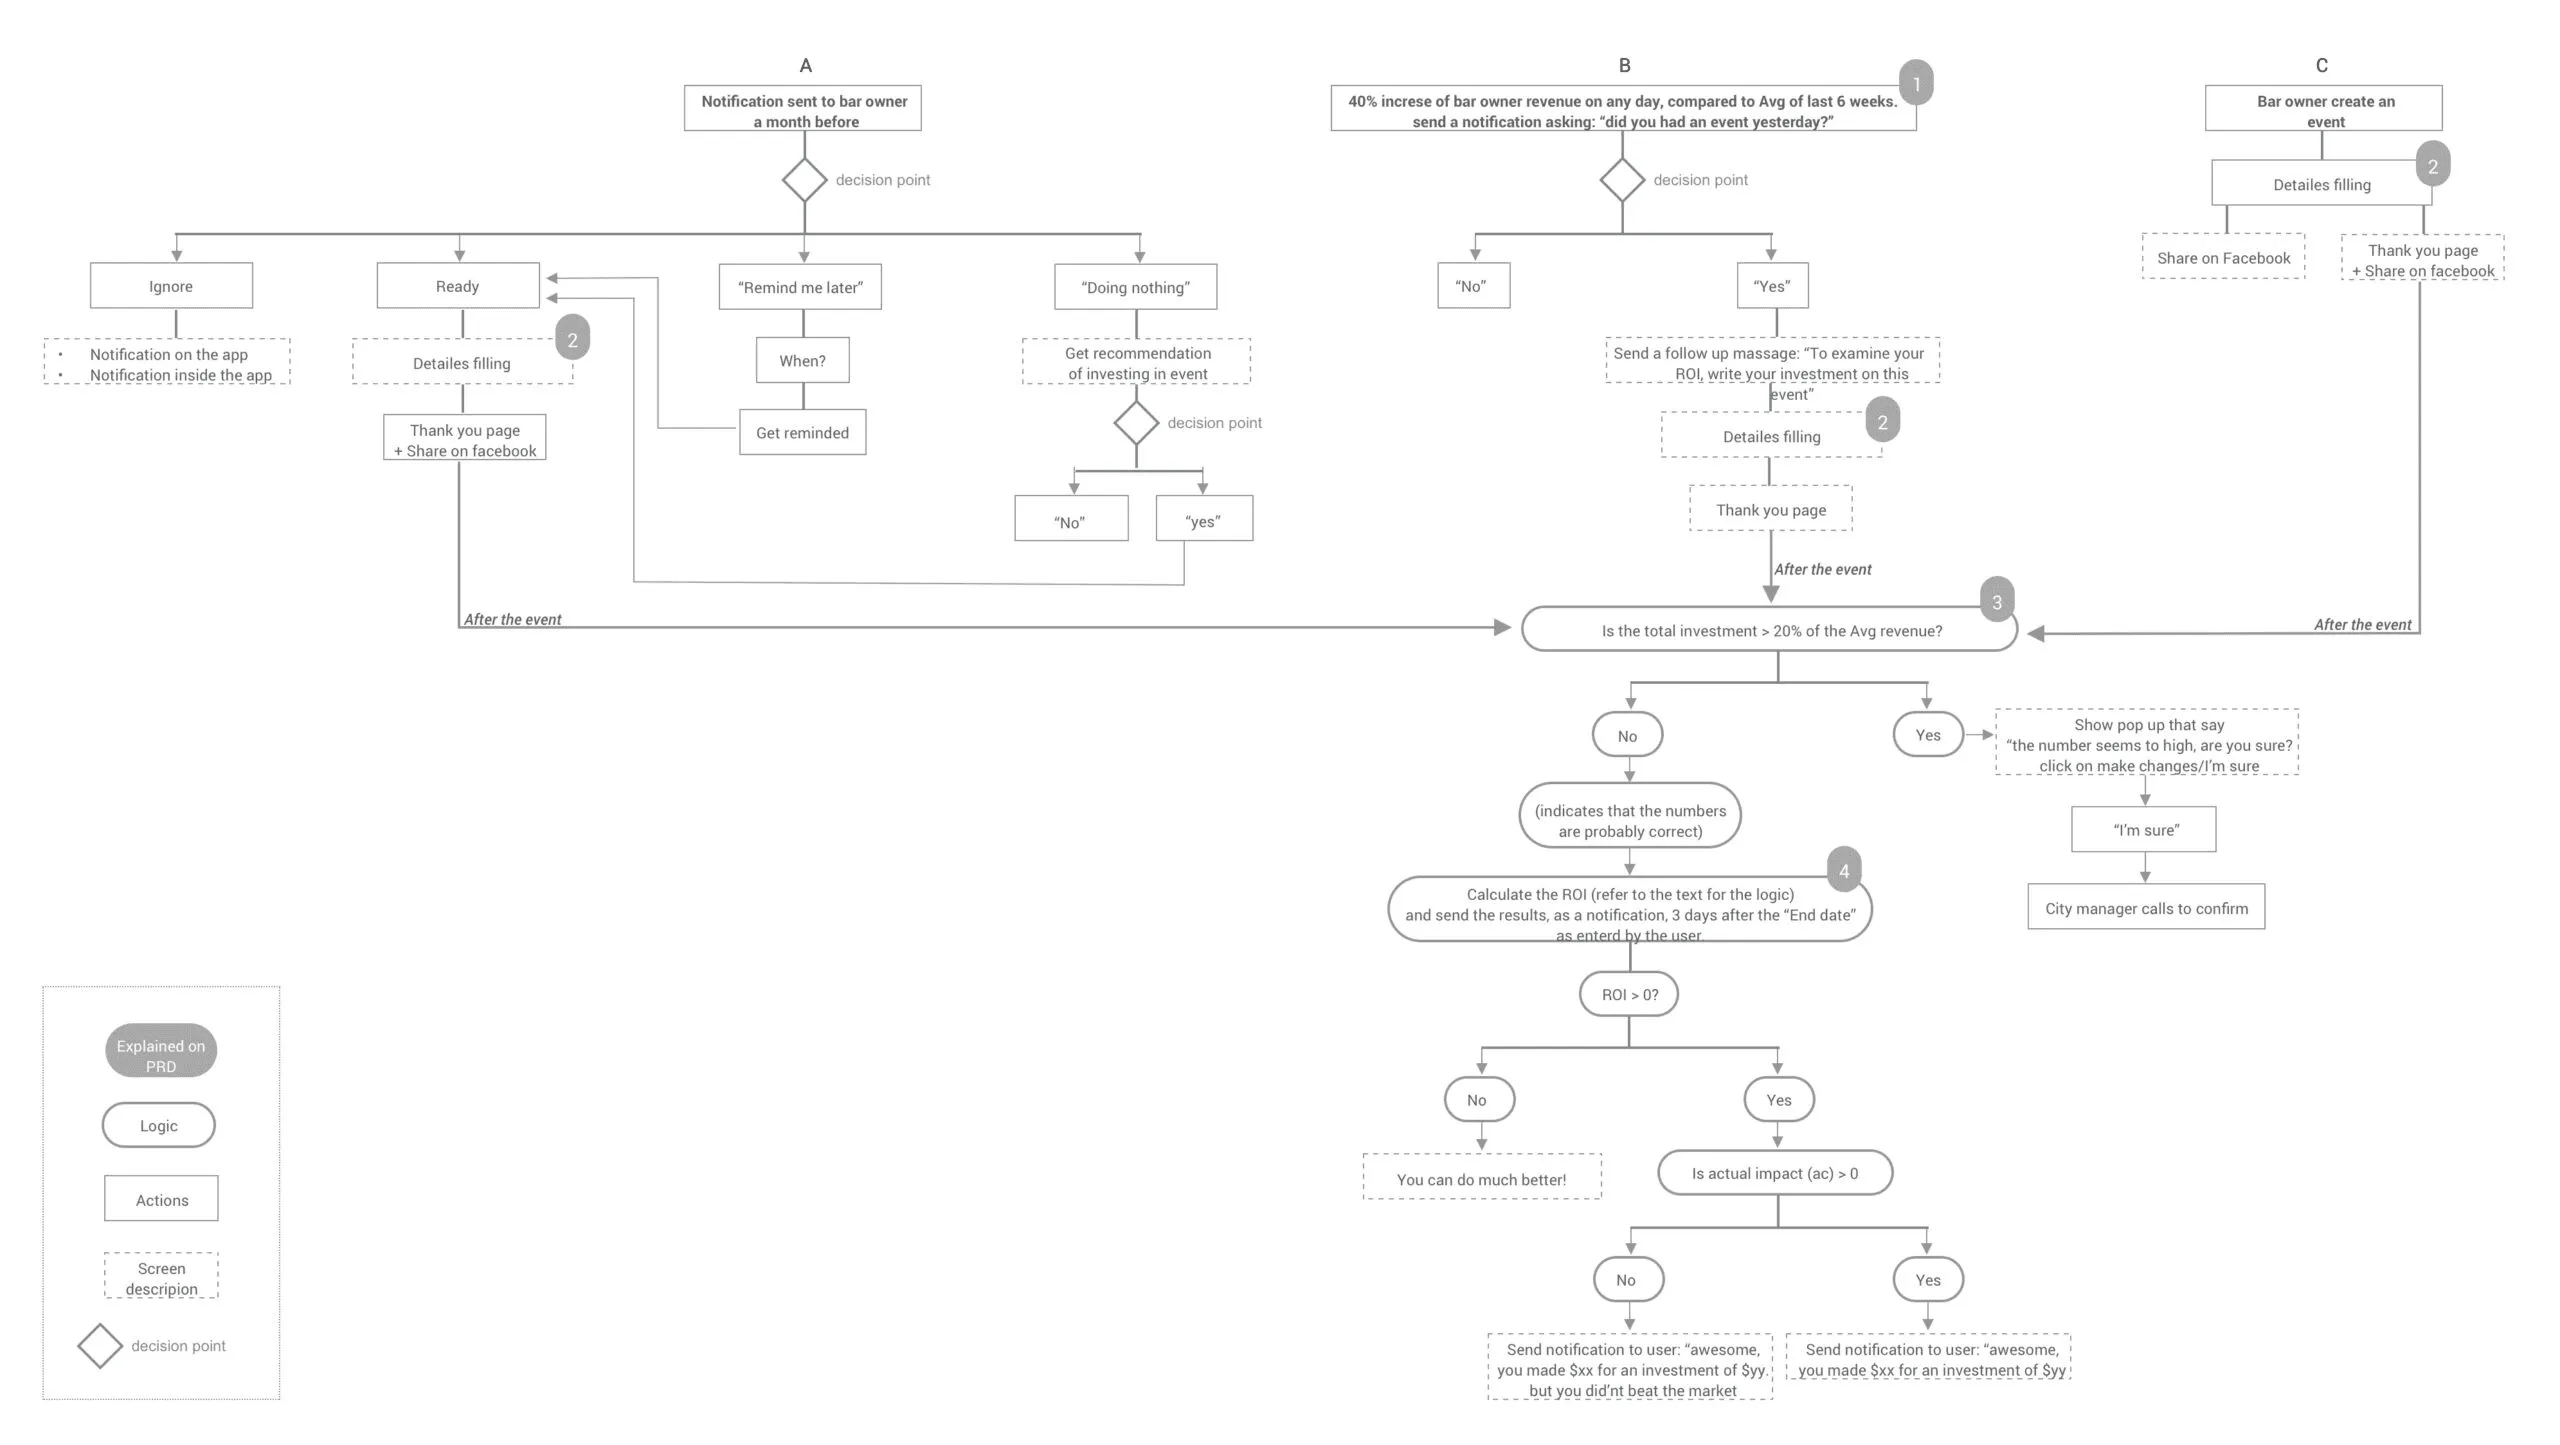
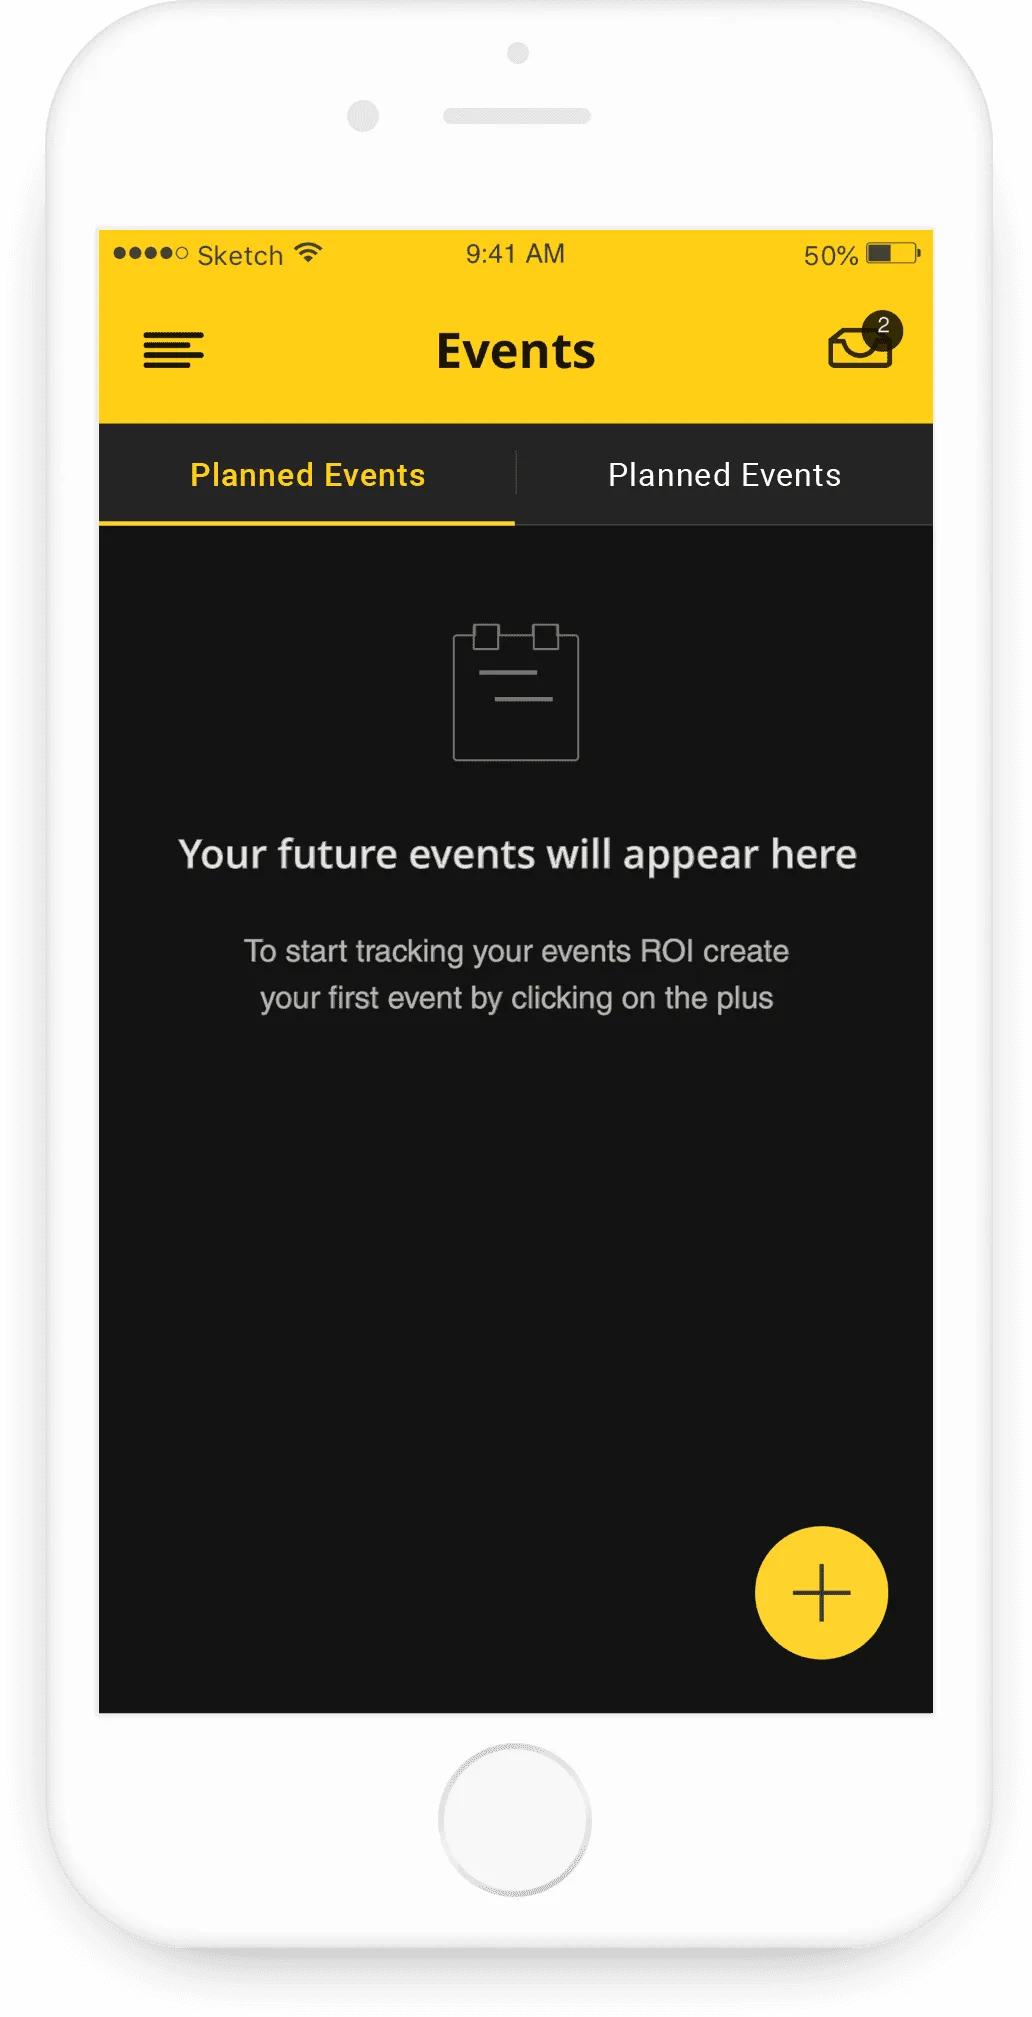
Event planning is a way to track the success and ROI of special events that take place in the venue
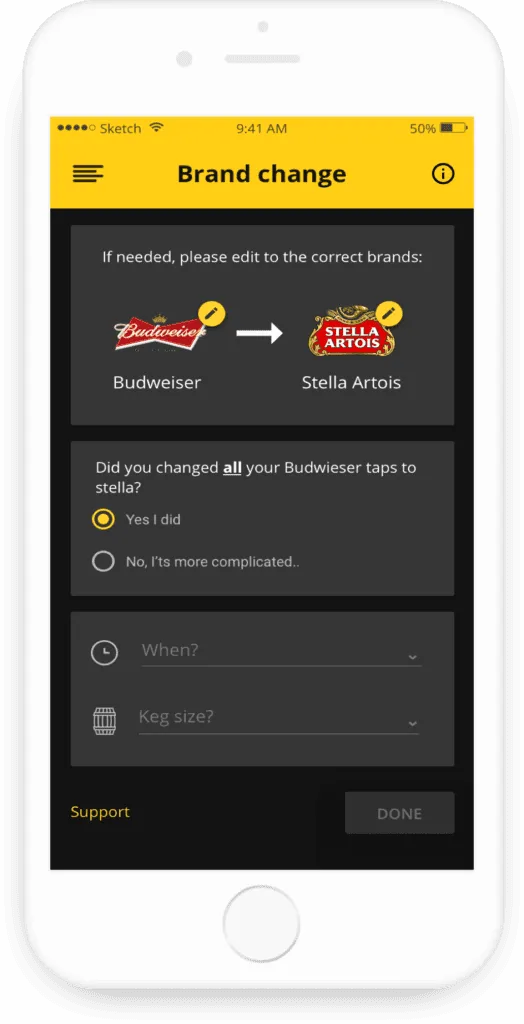
If a sensor noticed a beer keg change, we asked the user to confirm it