The problem
- Raw data tables lacking insights
- Information scattered across system
- No design system = slow time to value
Business Impact
- High support team workload (custom report requests)
- Users frustrated, can’t self-serve
- No consistent design and lack of agility
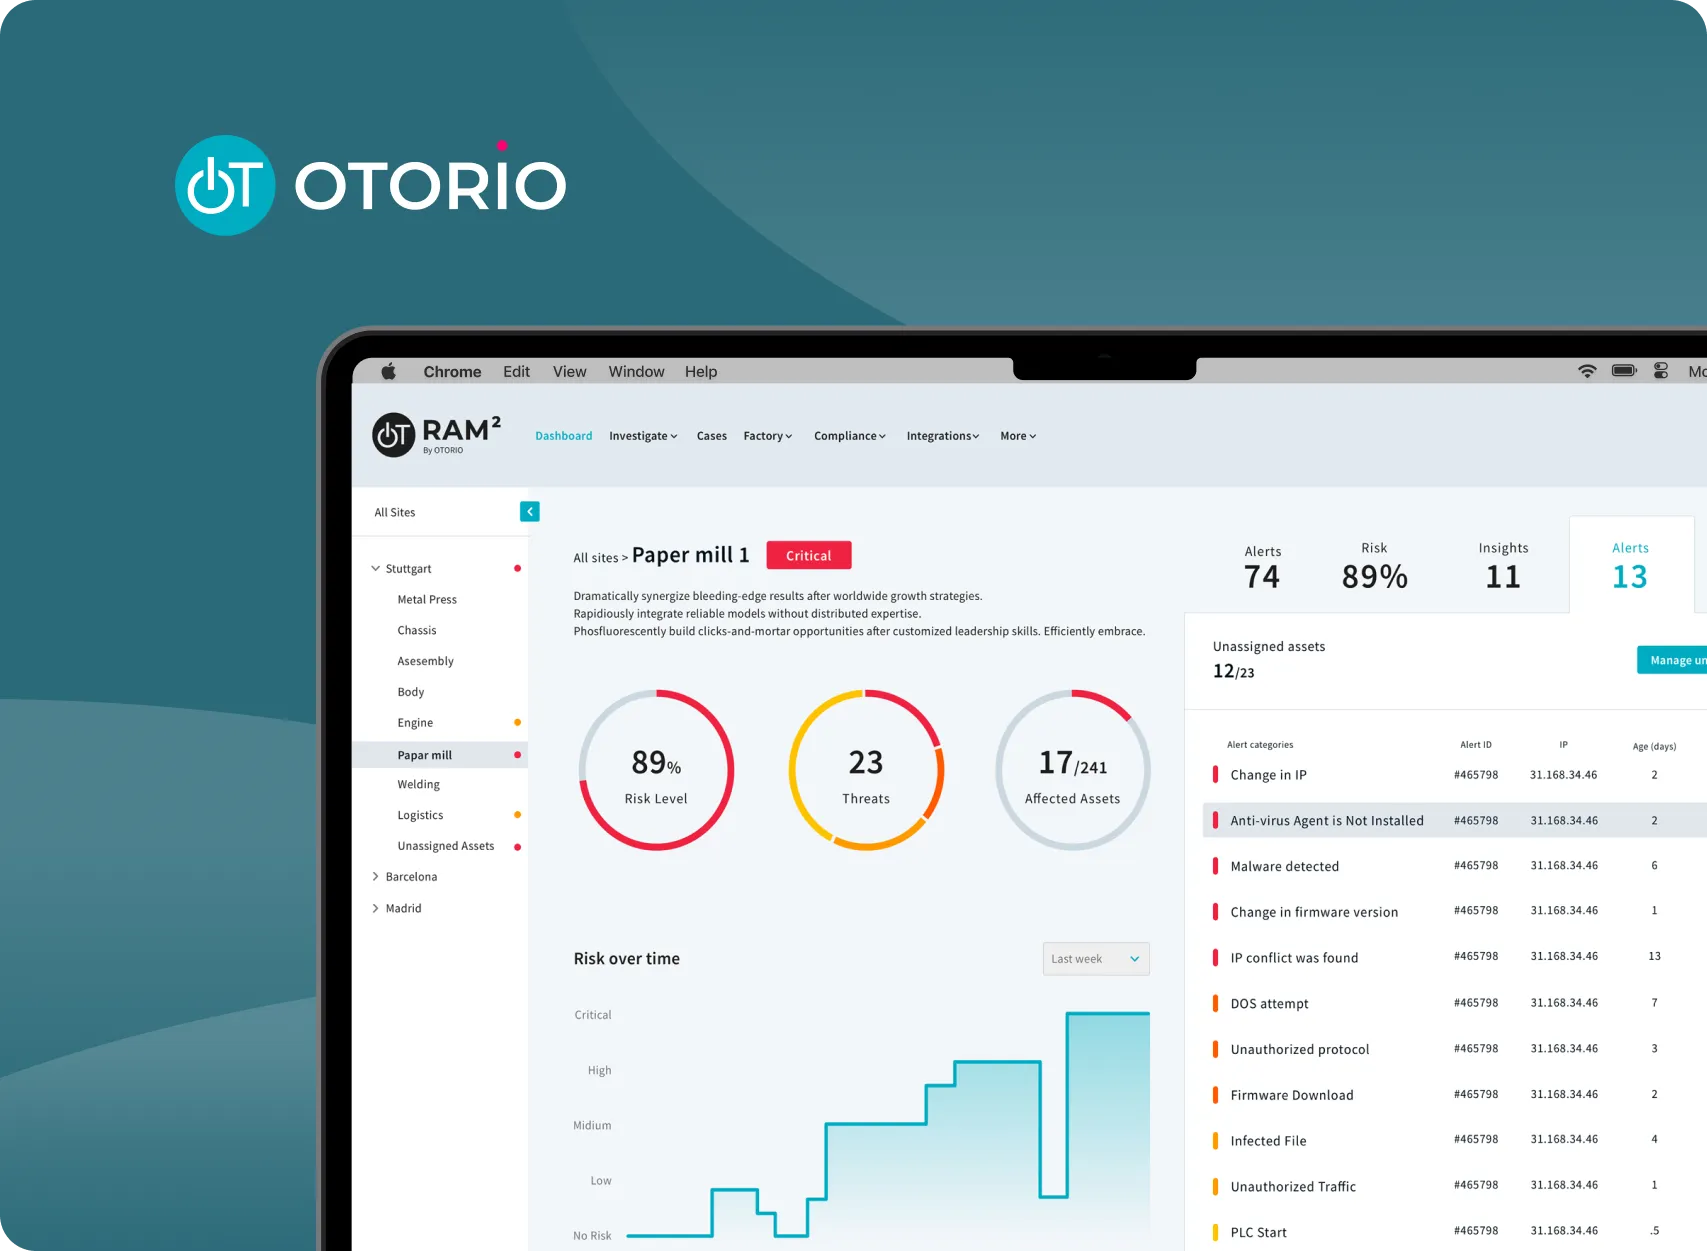
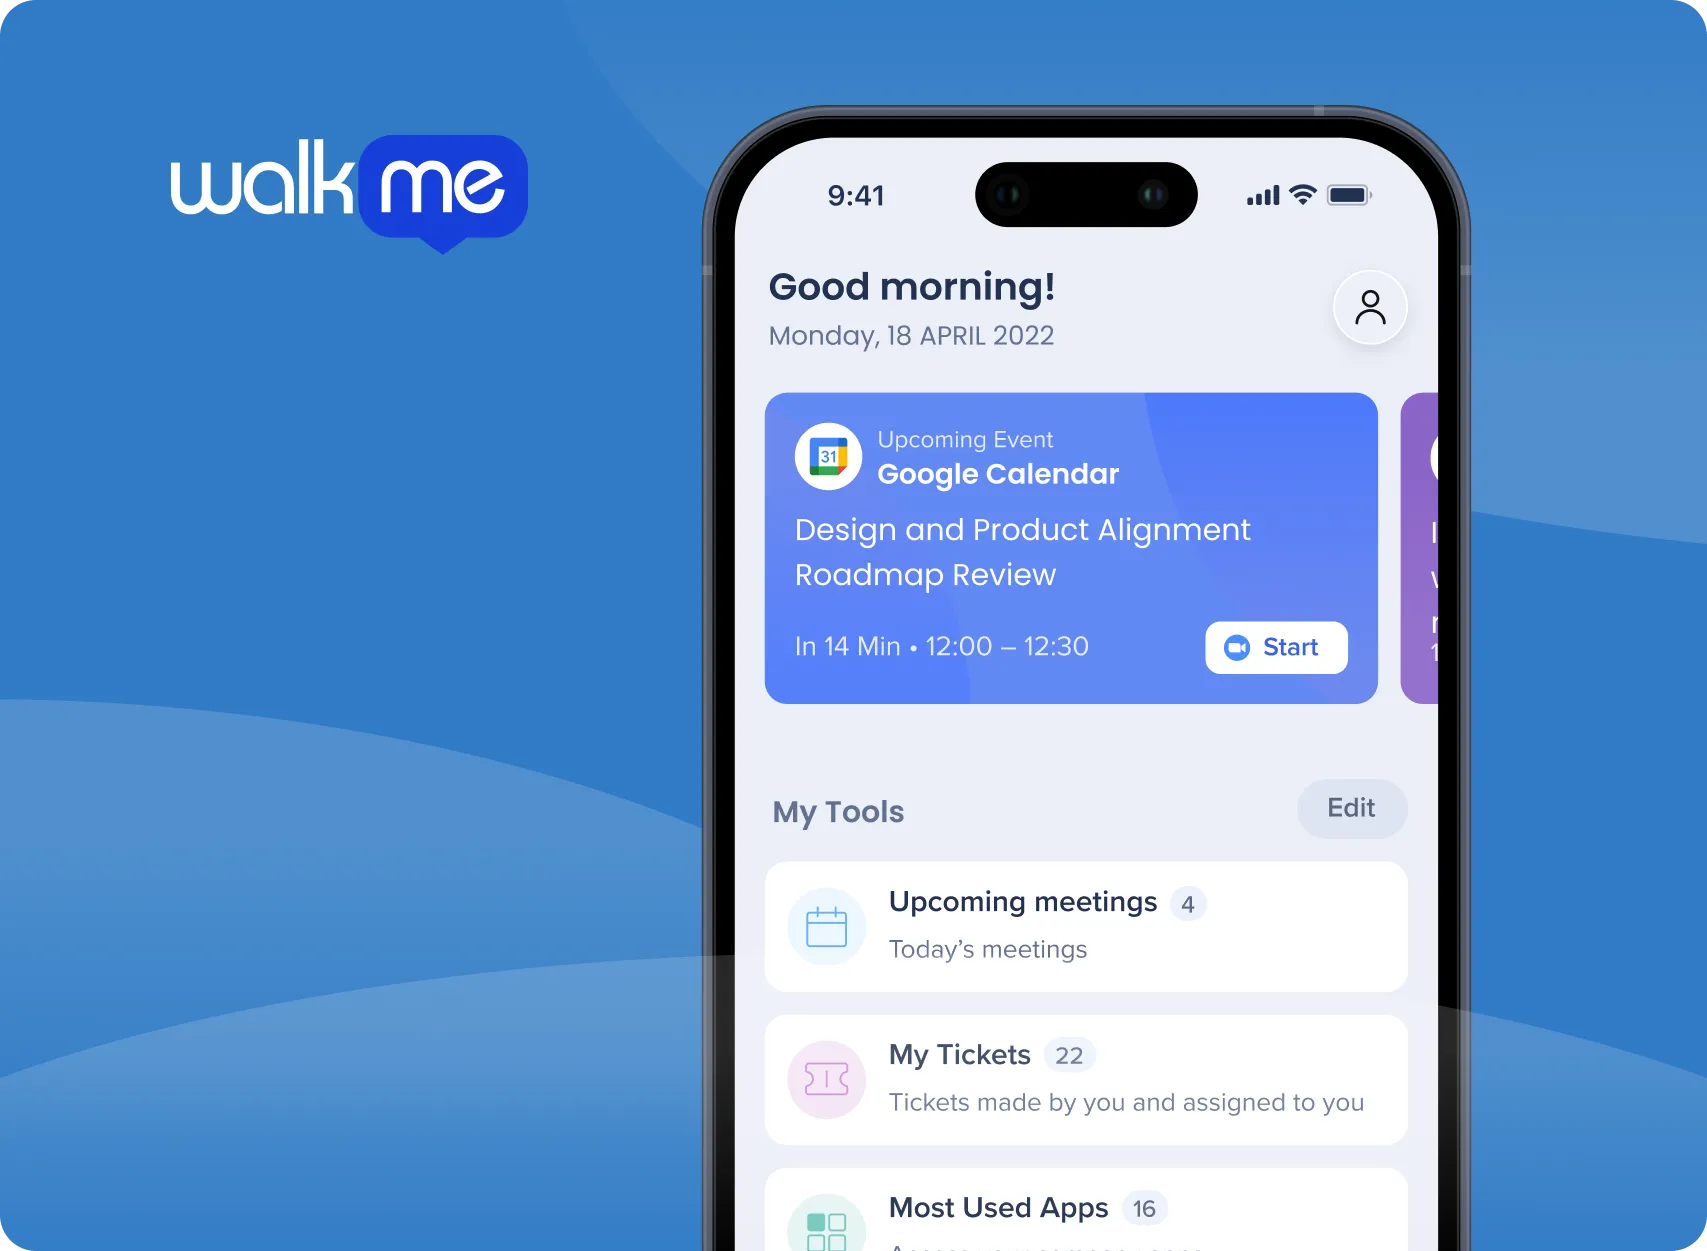
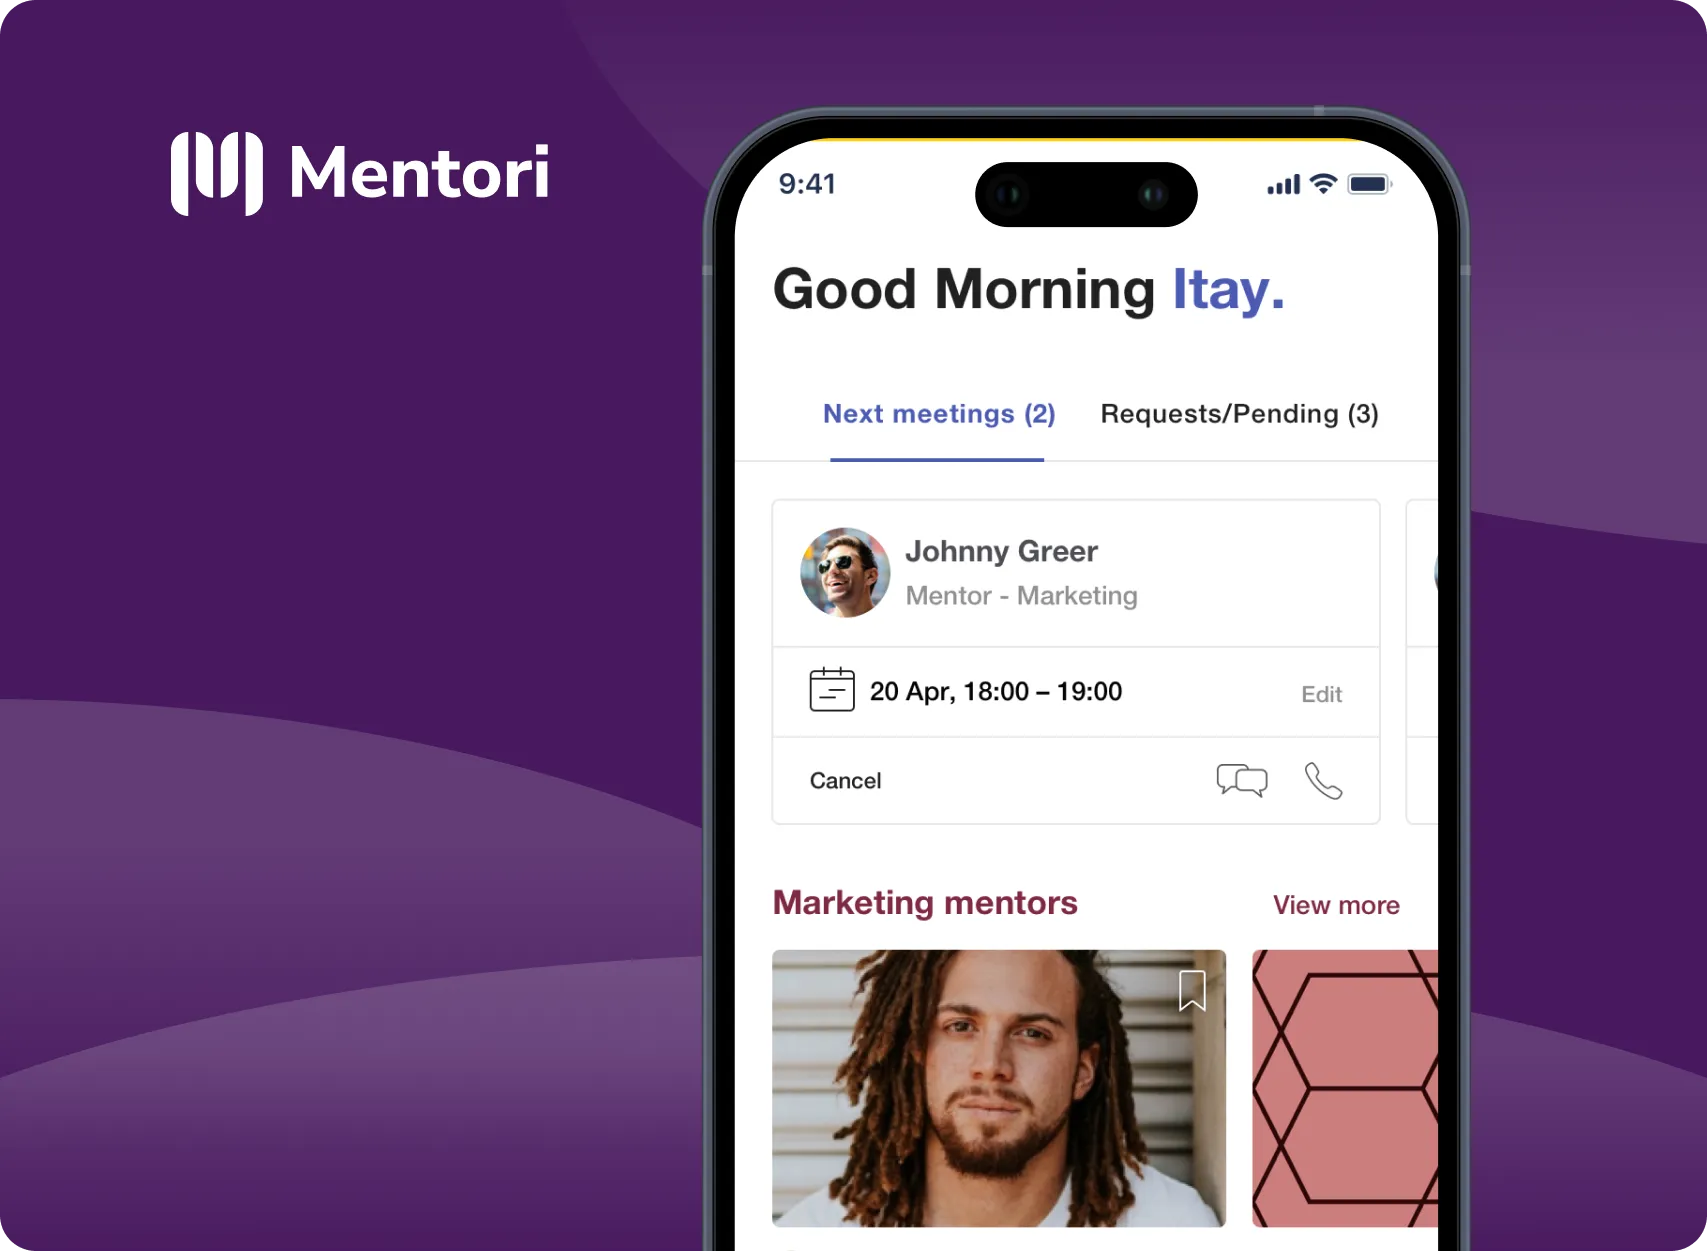
The old version
Goal
- Self-service dashboard with actionable insights for mobile and web
- Unified, intuitive interface for purchase management
- Scalable design system for speed
RESEARCH
Understanding Our Users
- Conducted interviews with restaurant owners and managers
- Some Clarity team members are active restaurant owners and former managers, giving us direct insight into real user needs.
- User recordings (Smart Look) revealed what worked and what was confusing.r
Finding 1: Role-Specific Needs
- Restaurant Owners
- Restaurant Managers
- Purchase Managers - Day to day operations (pricing, delivery)
Finding 2: Cognitive load and appeal
- Big picture first, details on demand
- Visual charts, trends, and comparisons, not raw numbers
Jobs to be done
- Quickly see where money goes and spot issues.
- Focus negotiation on top suppliers/products when costs change.
- Instantly track compliance with approved products.
Testing solution direction using Wireframes
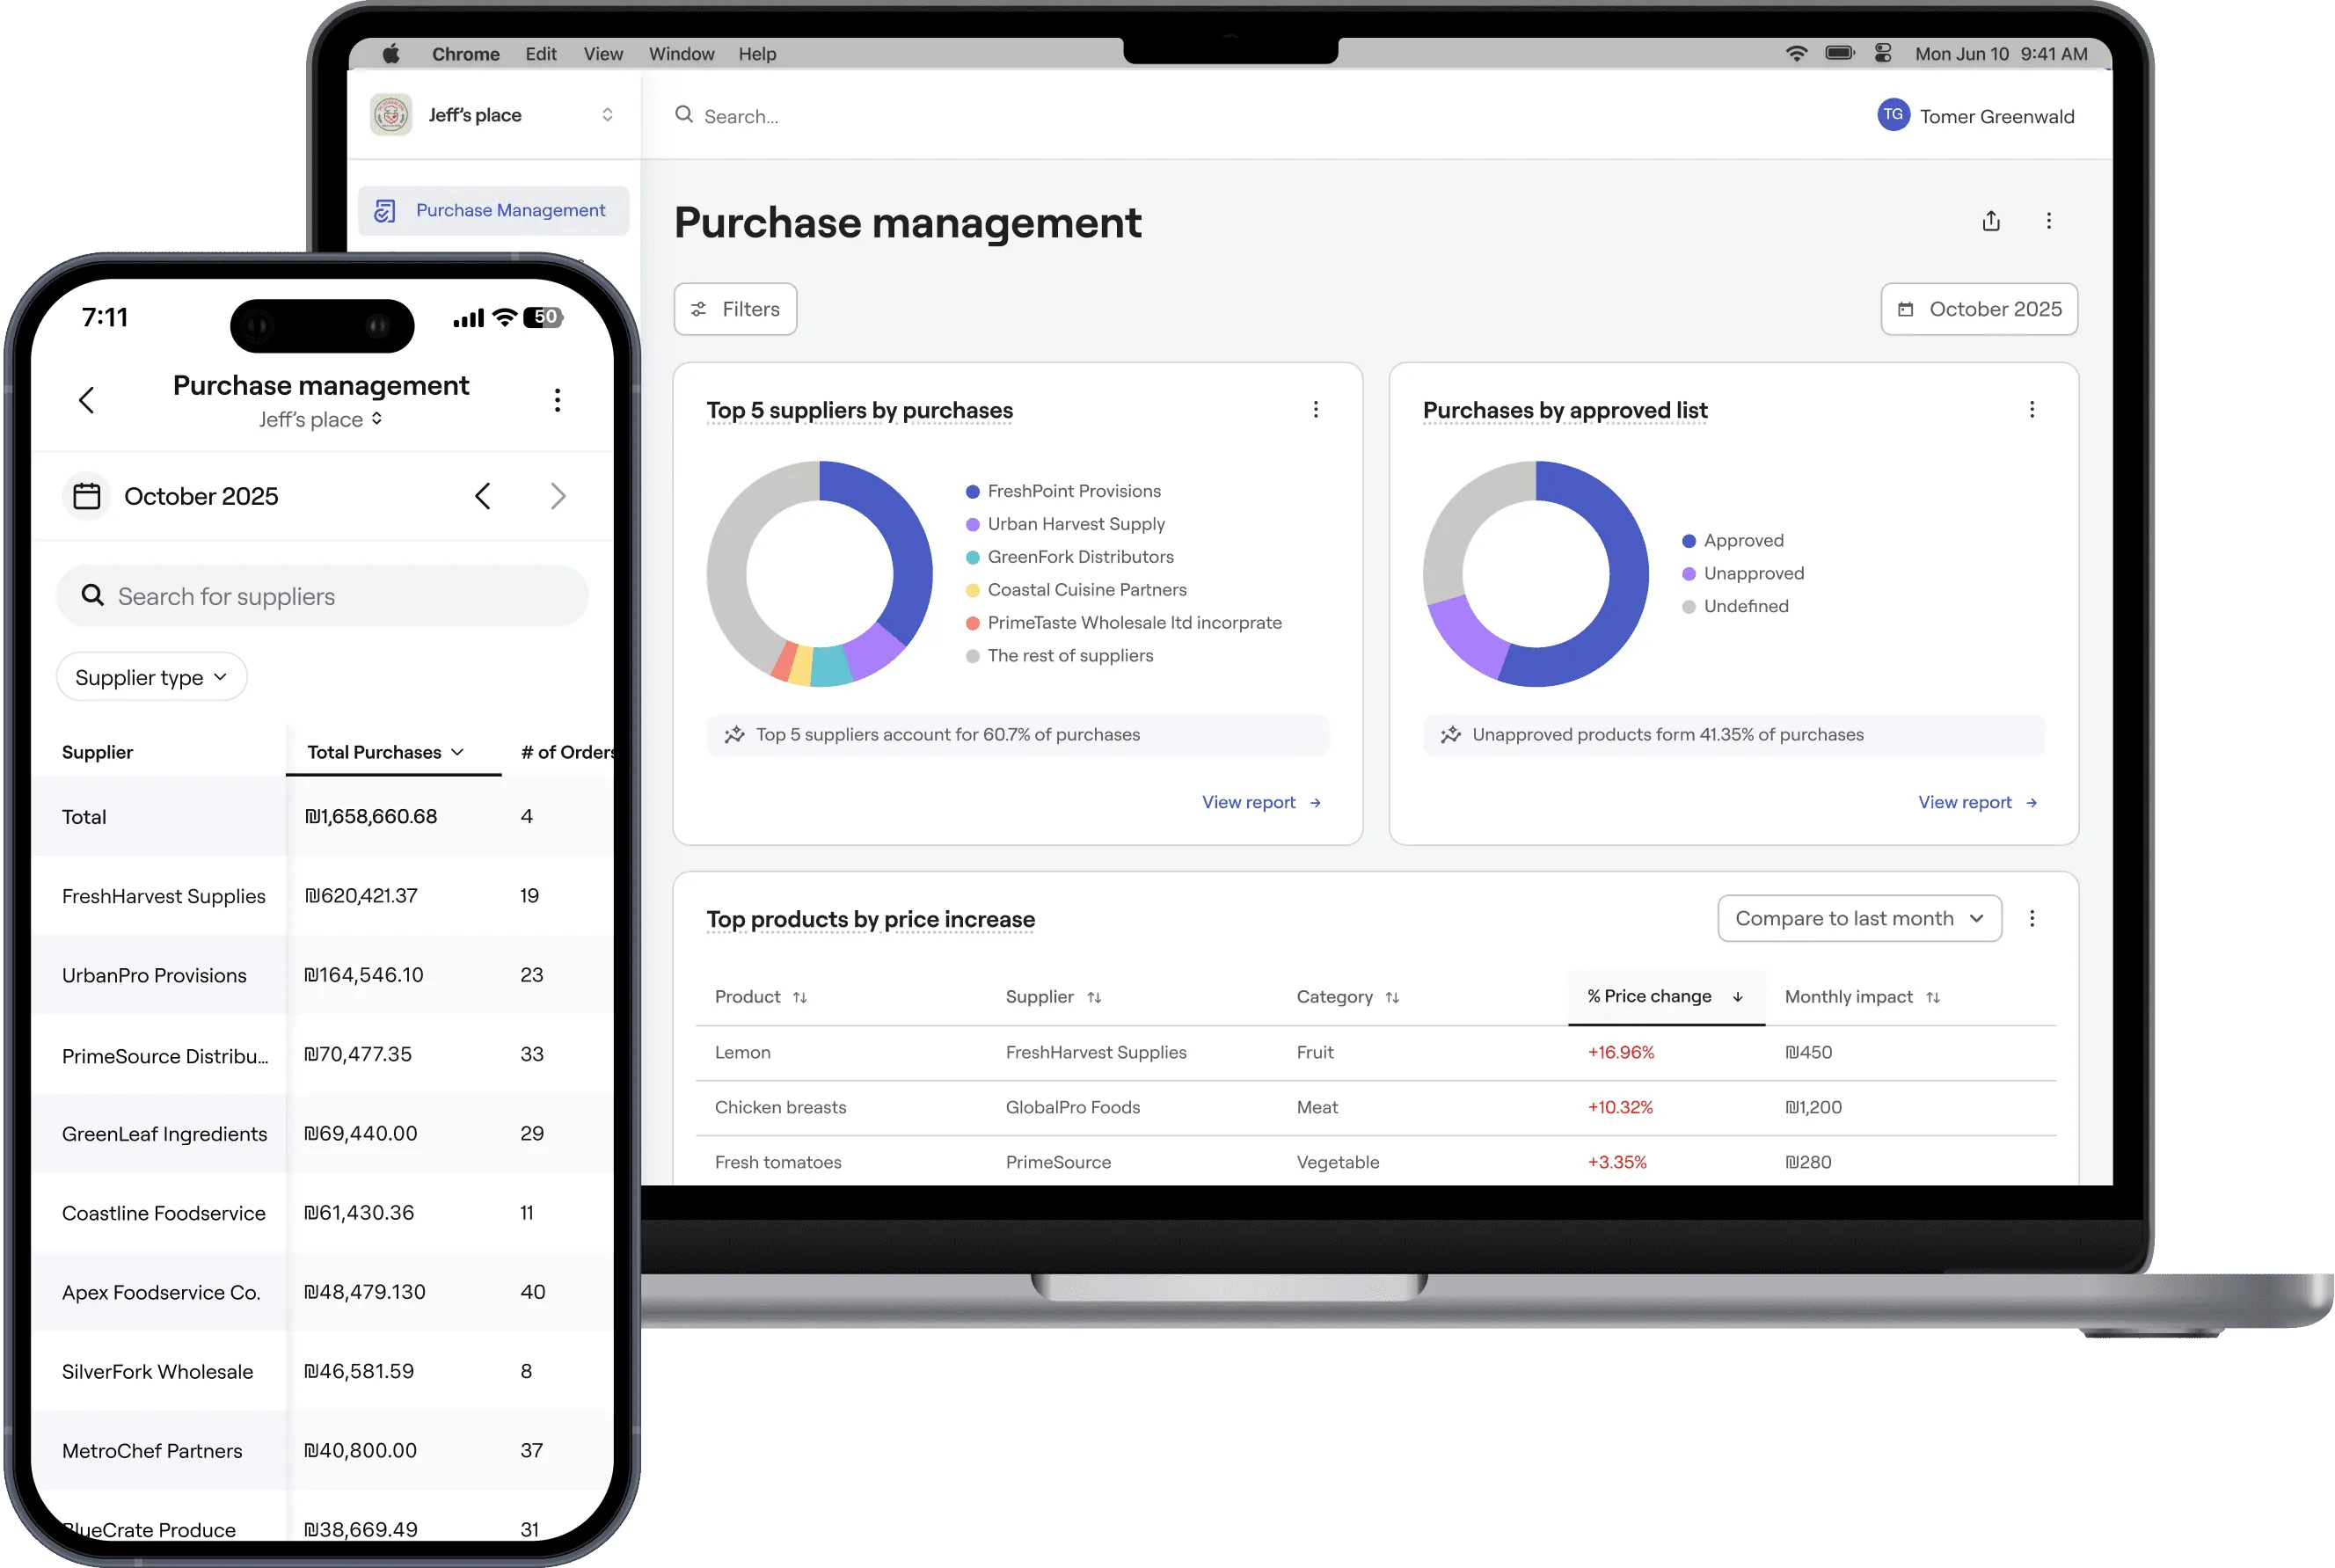
Solution
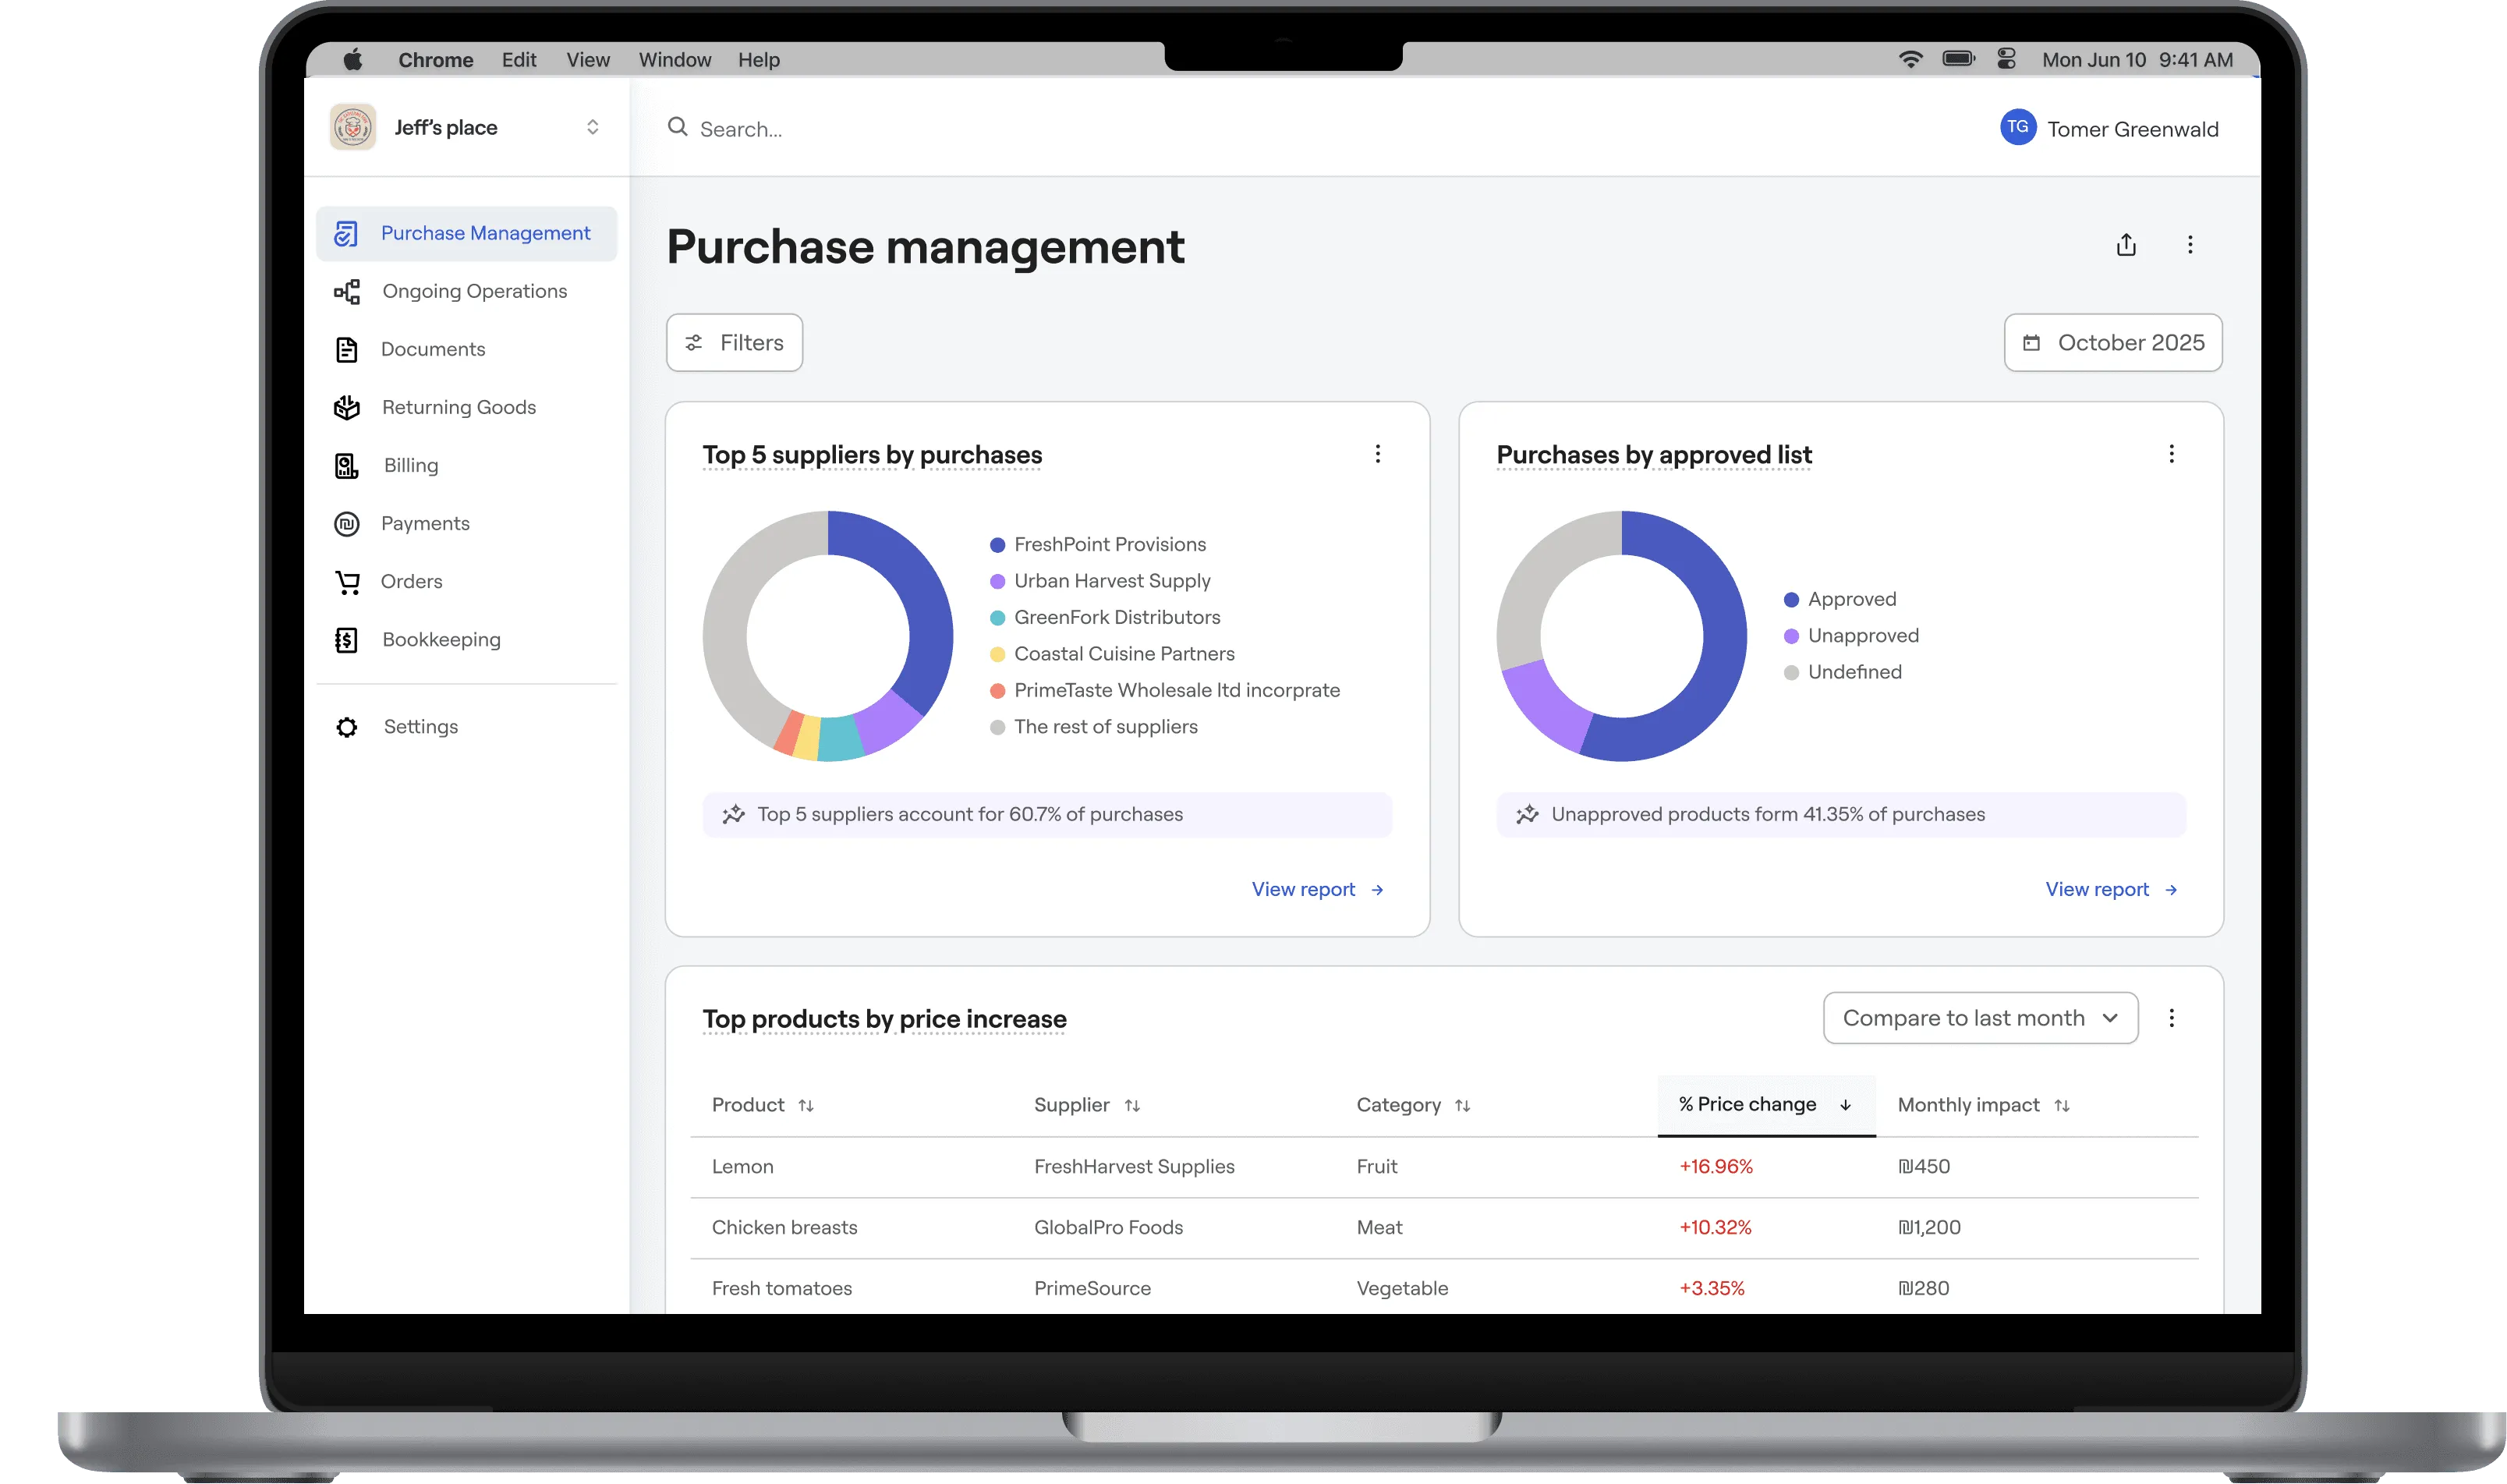
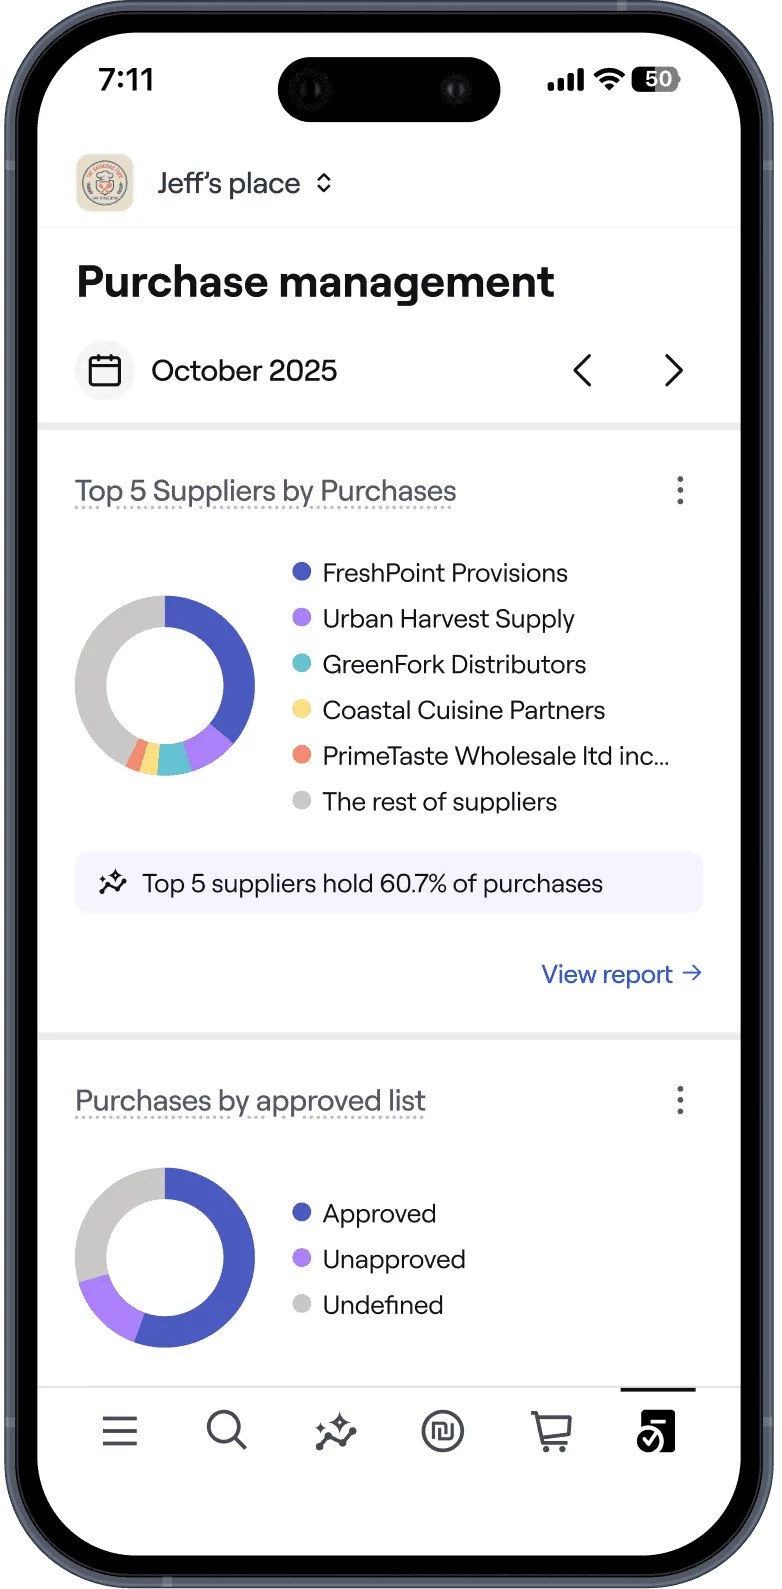
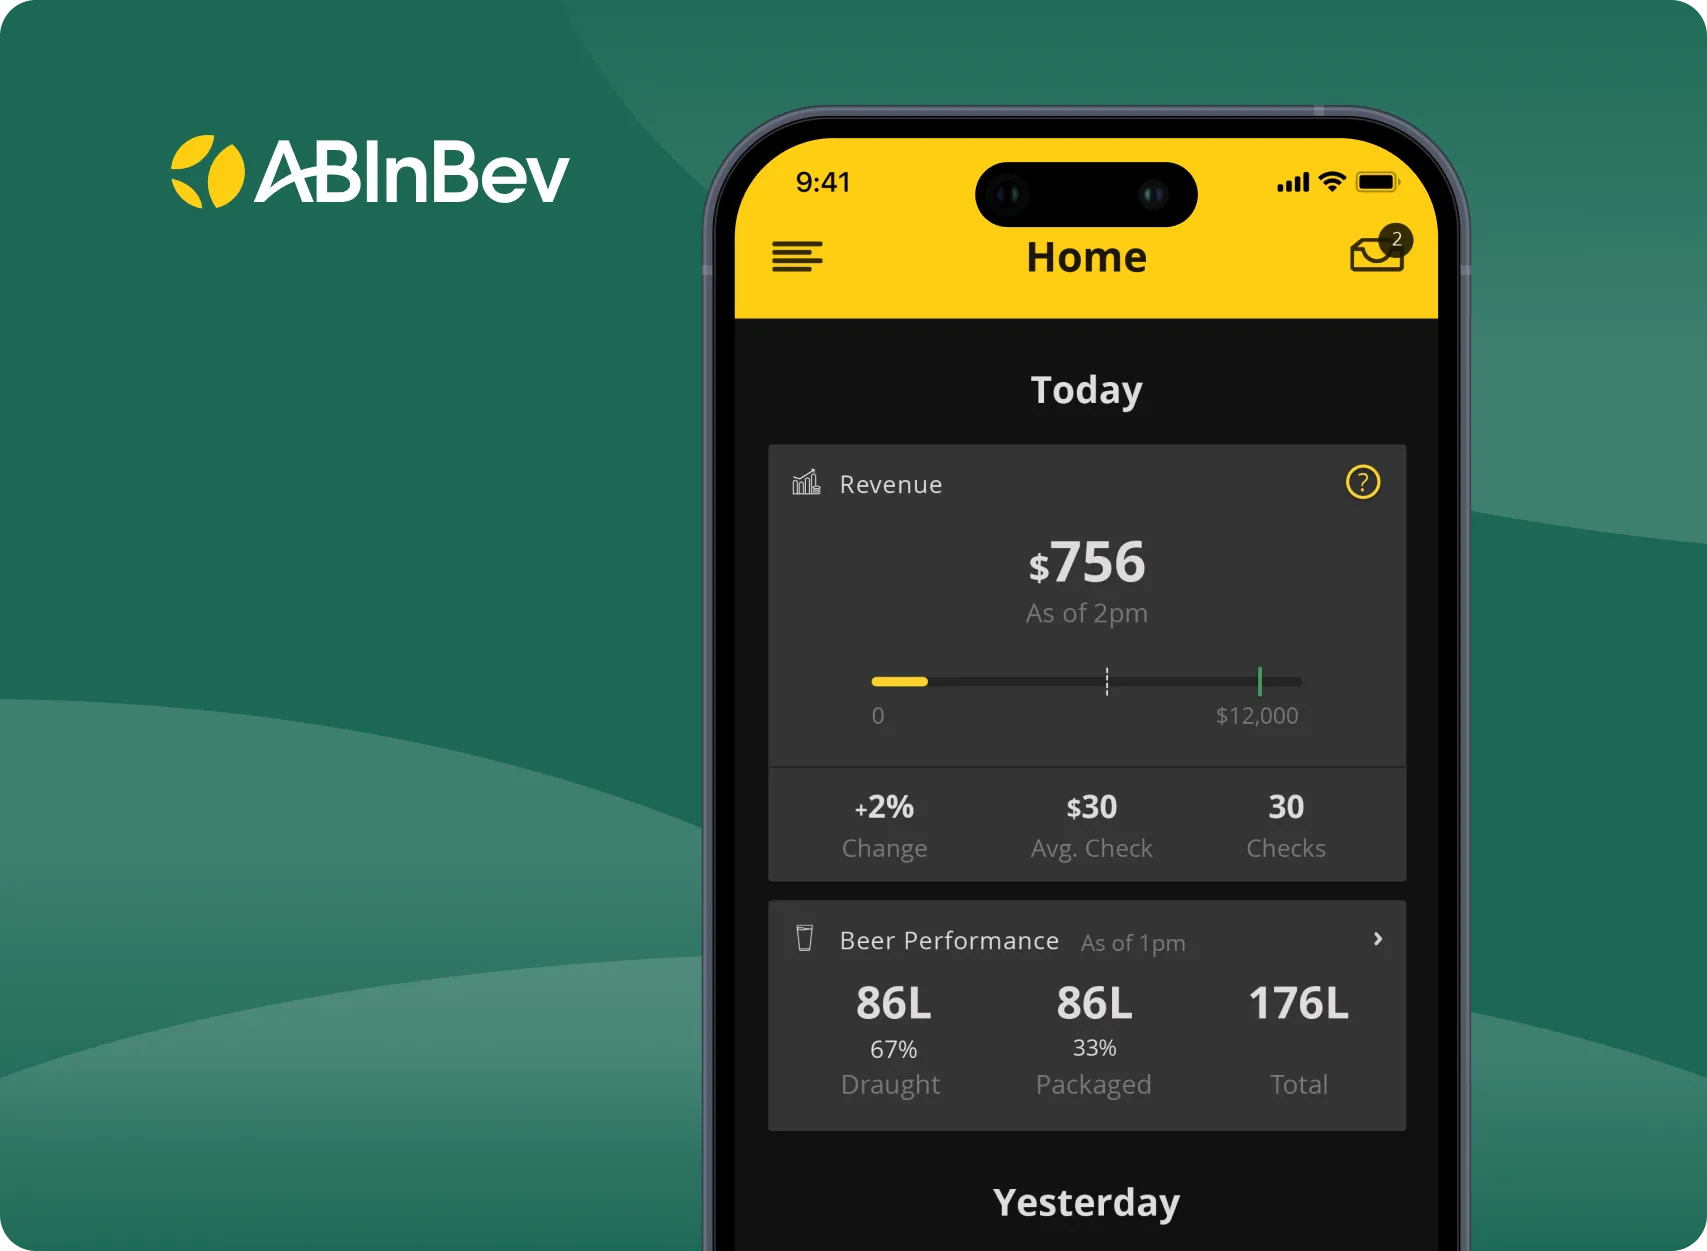
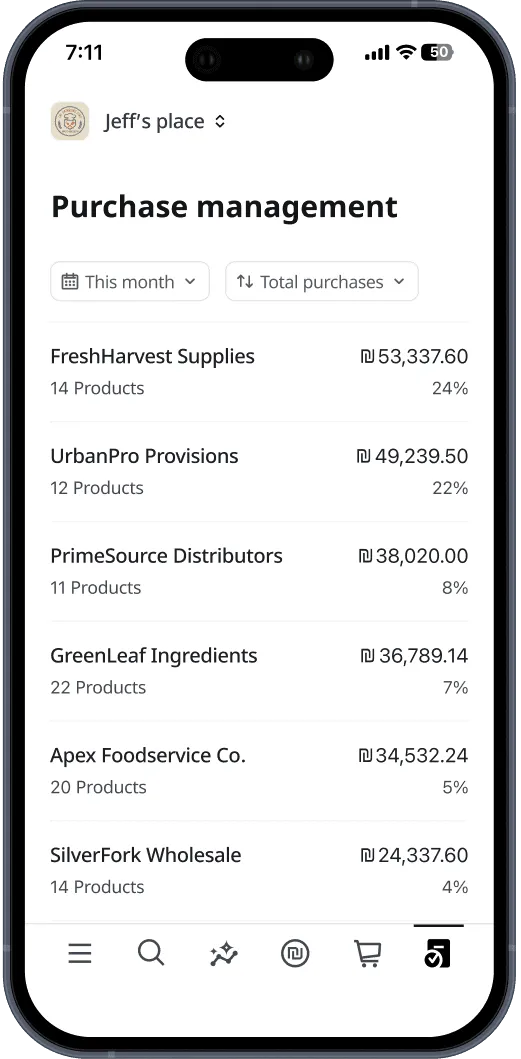
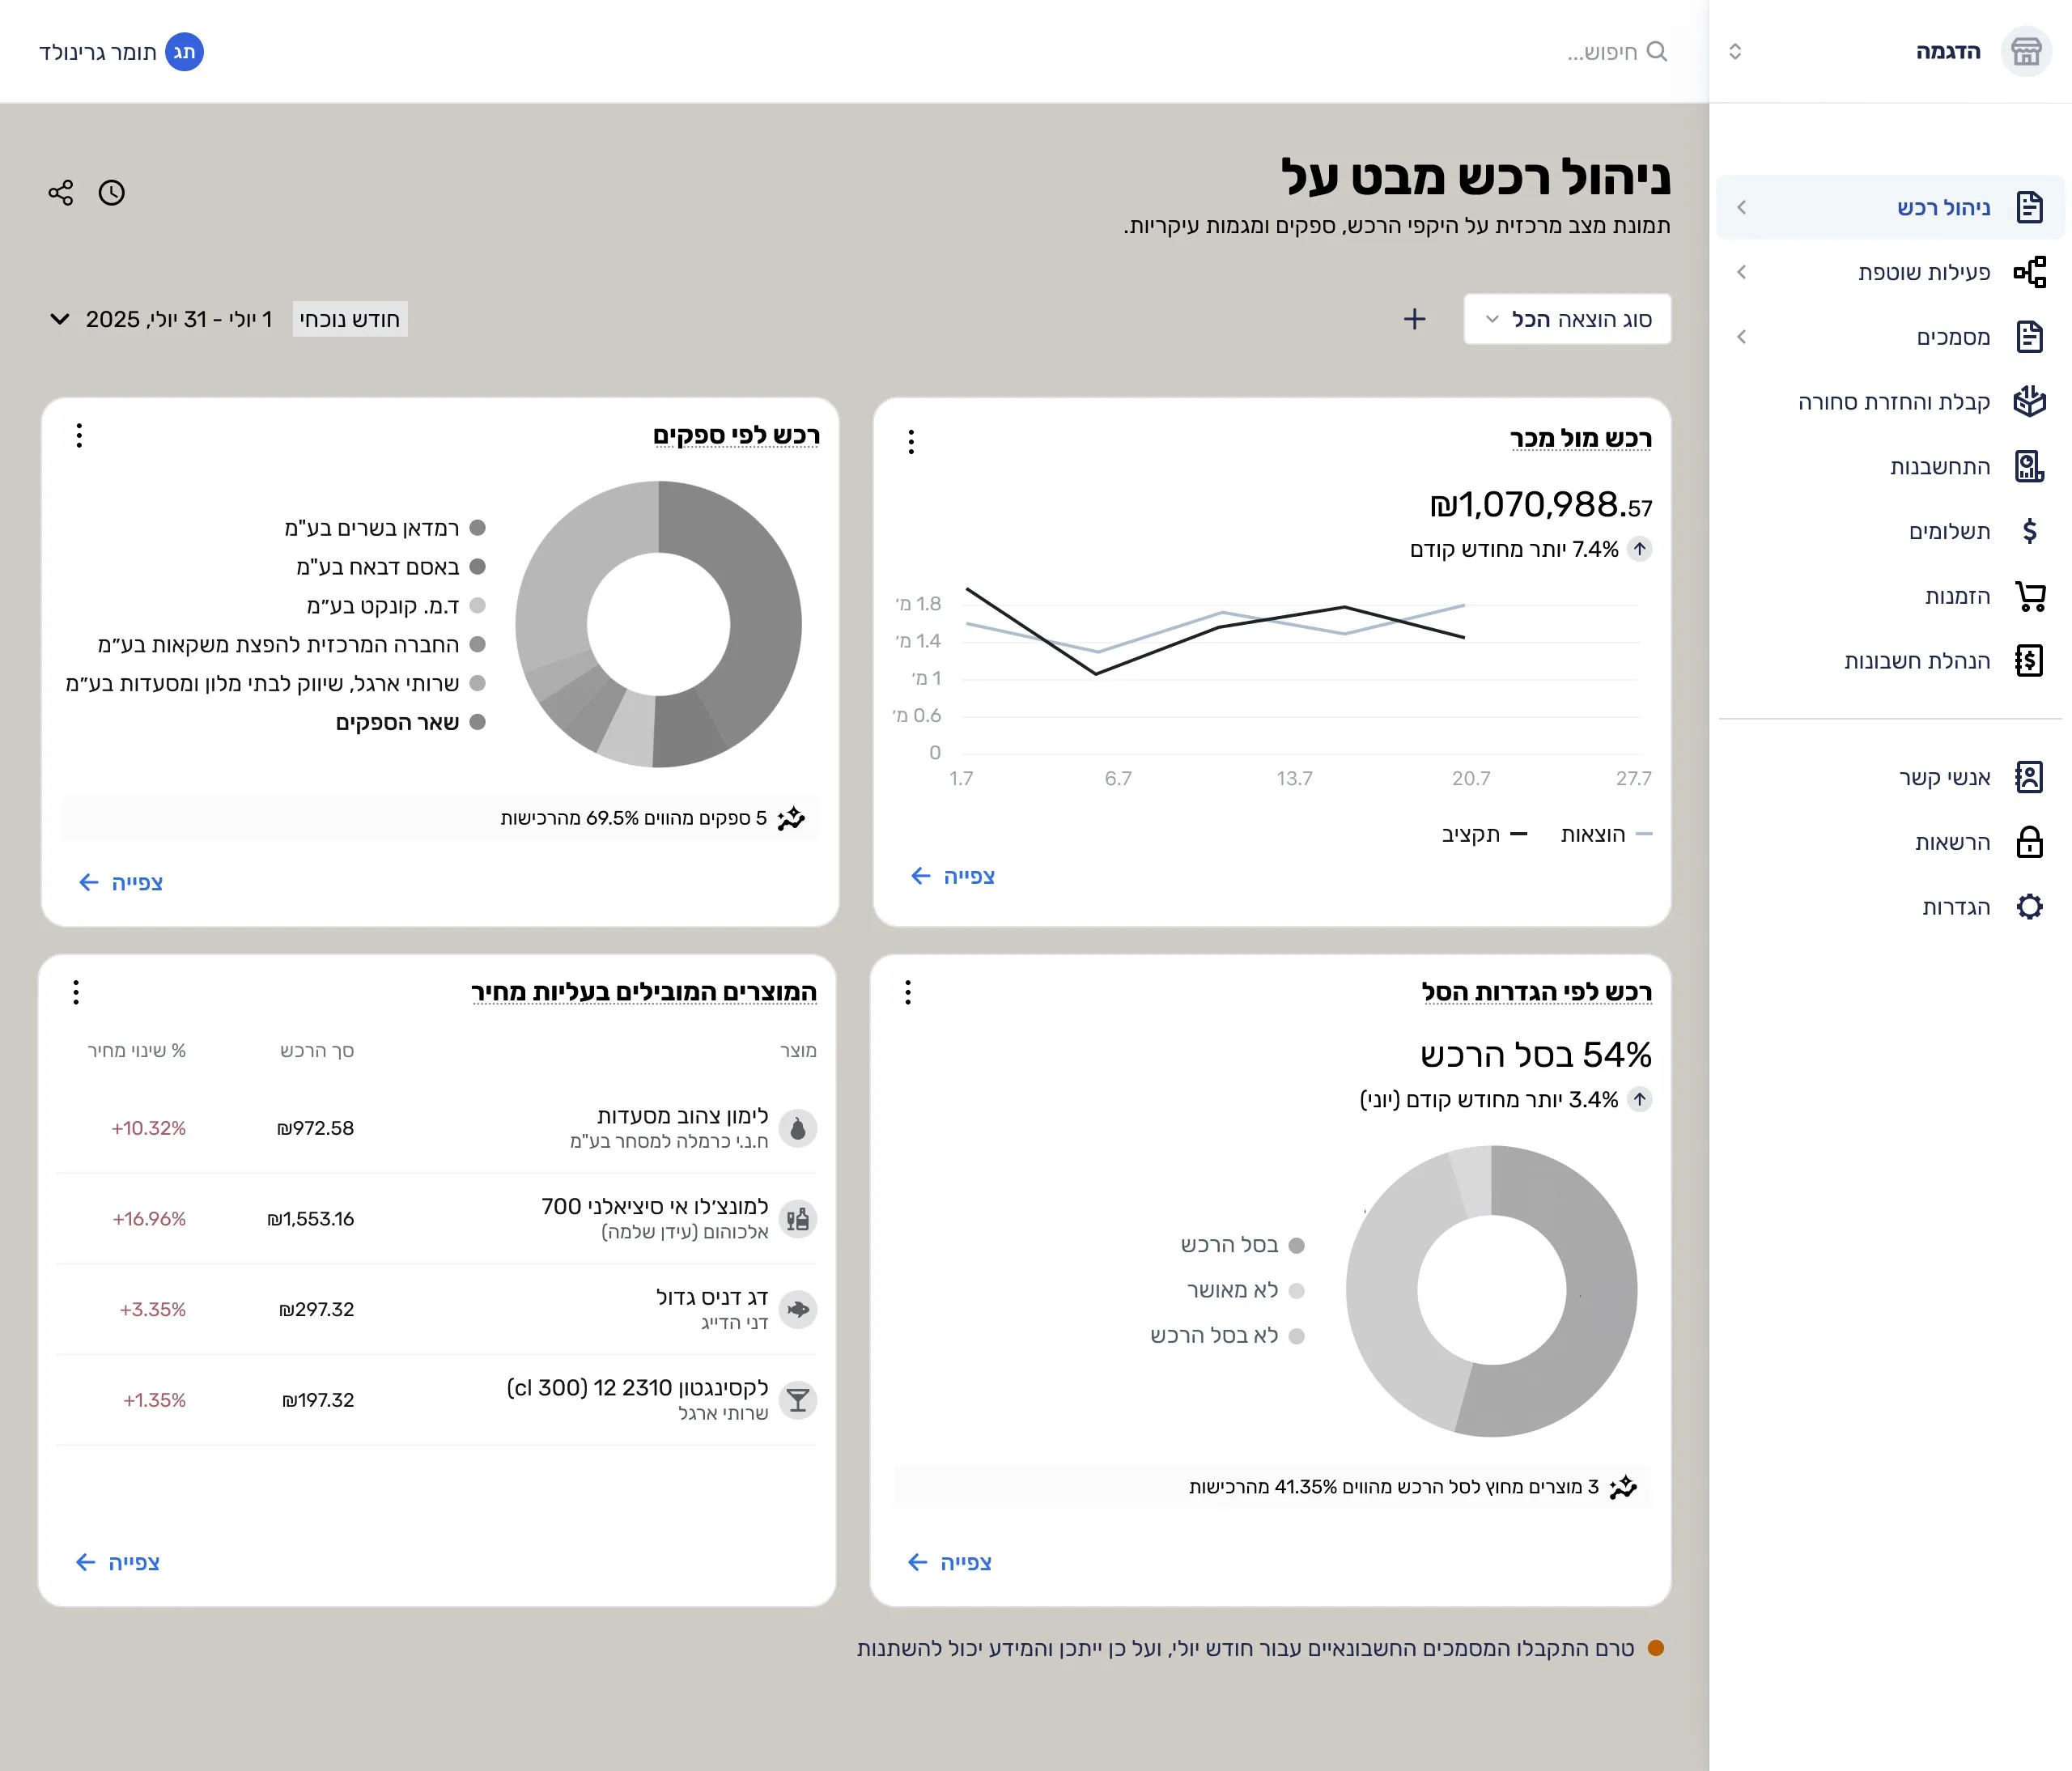
Centralized dashboard, overview at a glance
Desktop version optimized for focused deep work, and a mobile version designed to keep you informed while on the move.
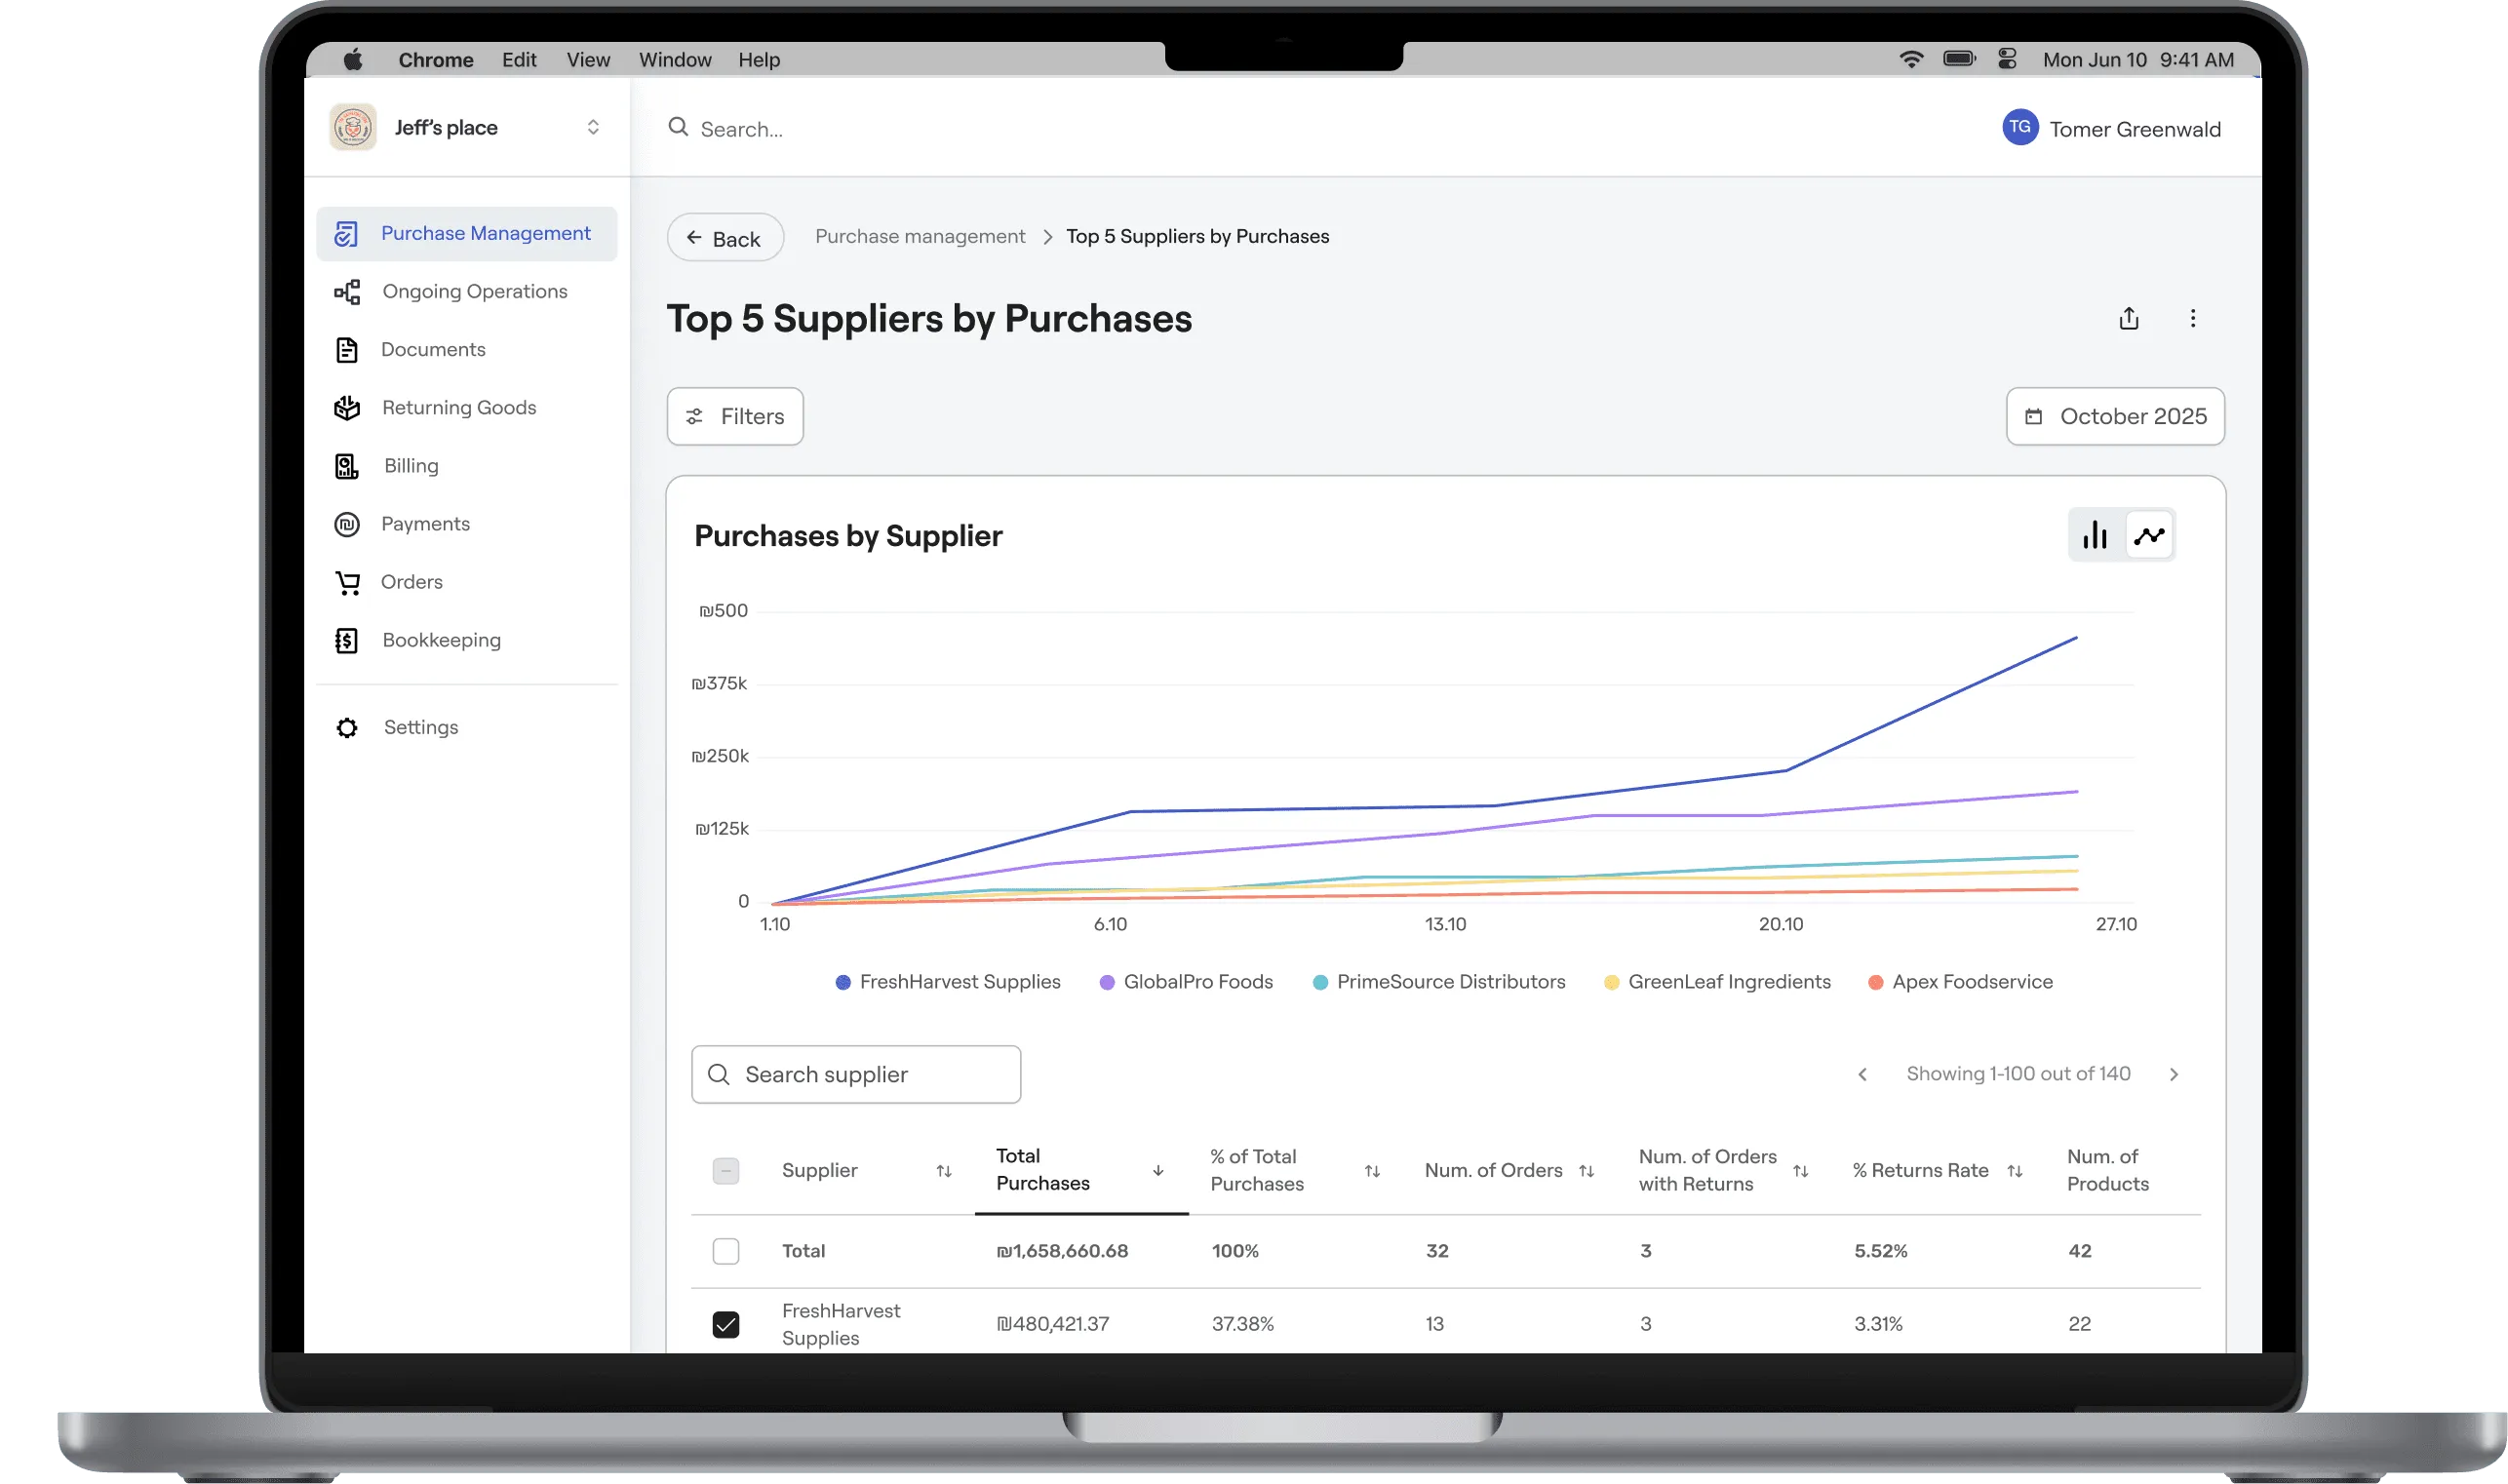
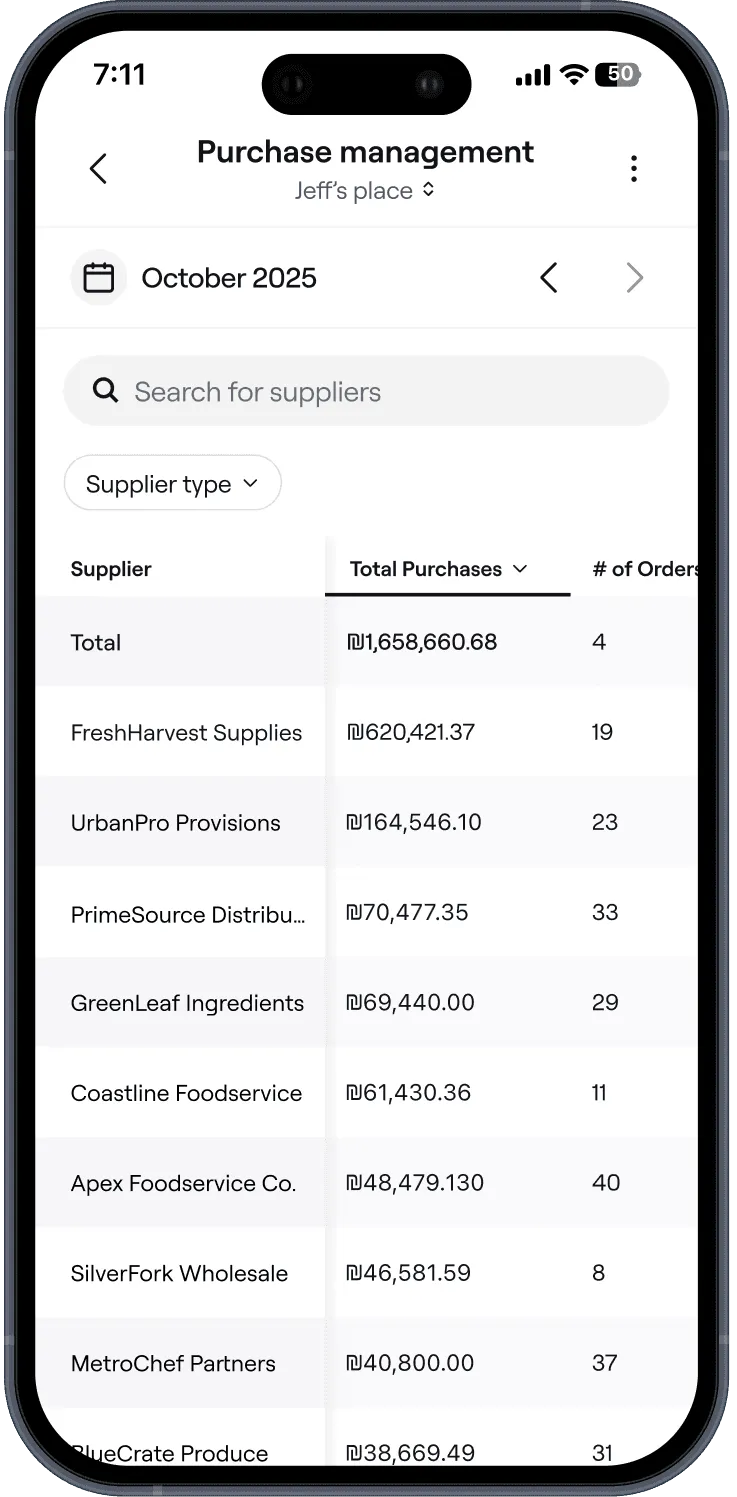
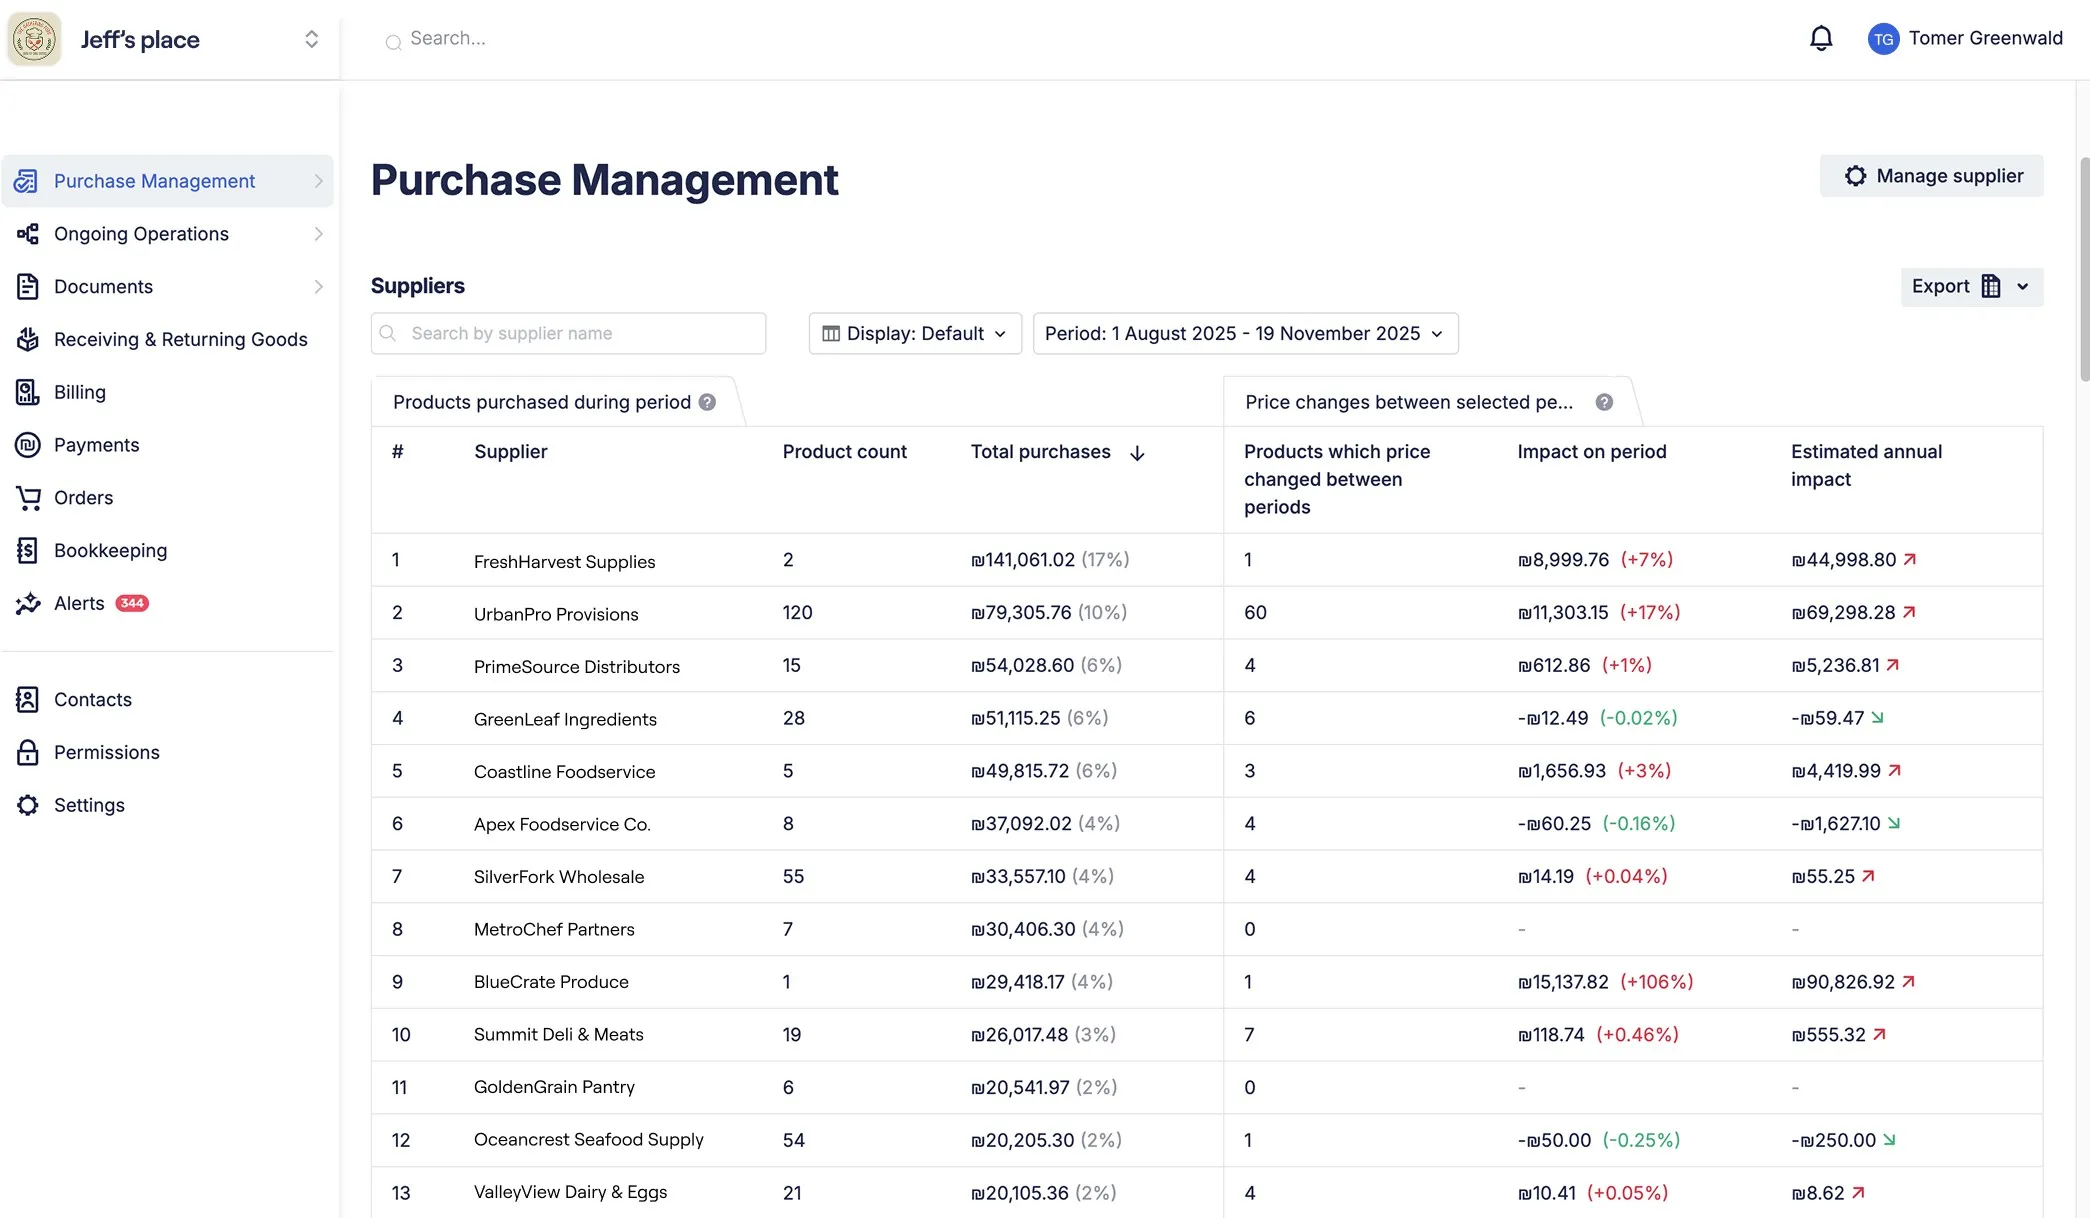
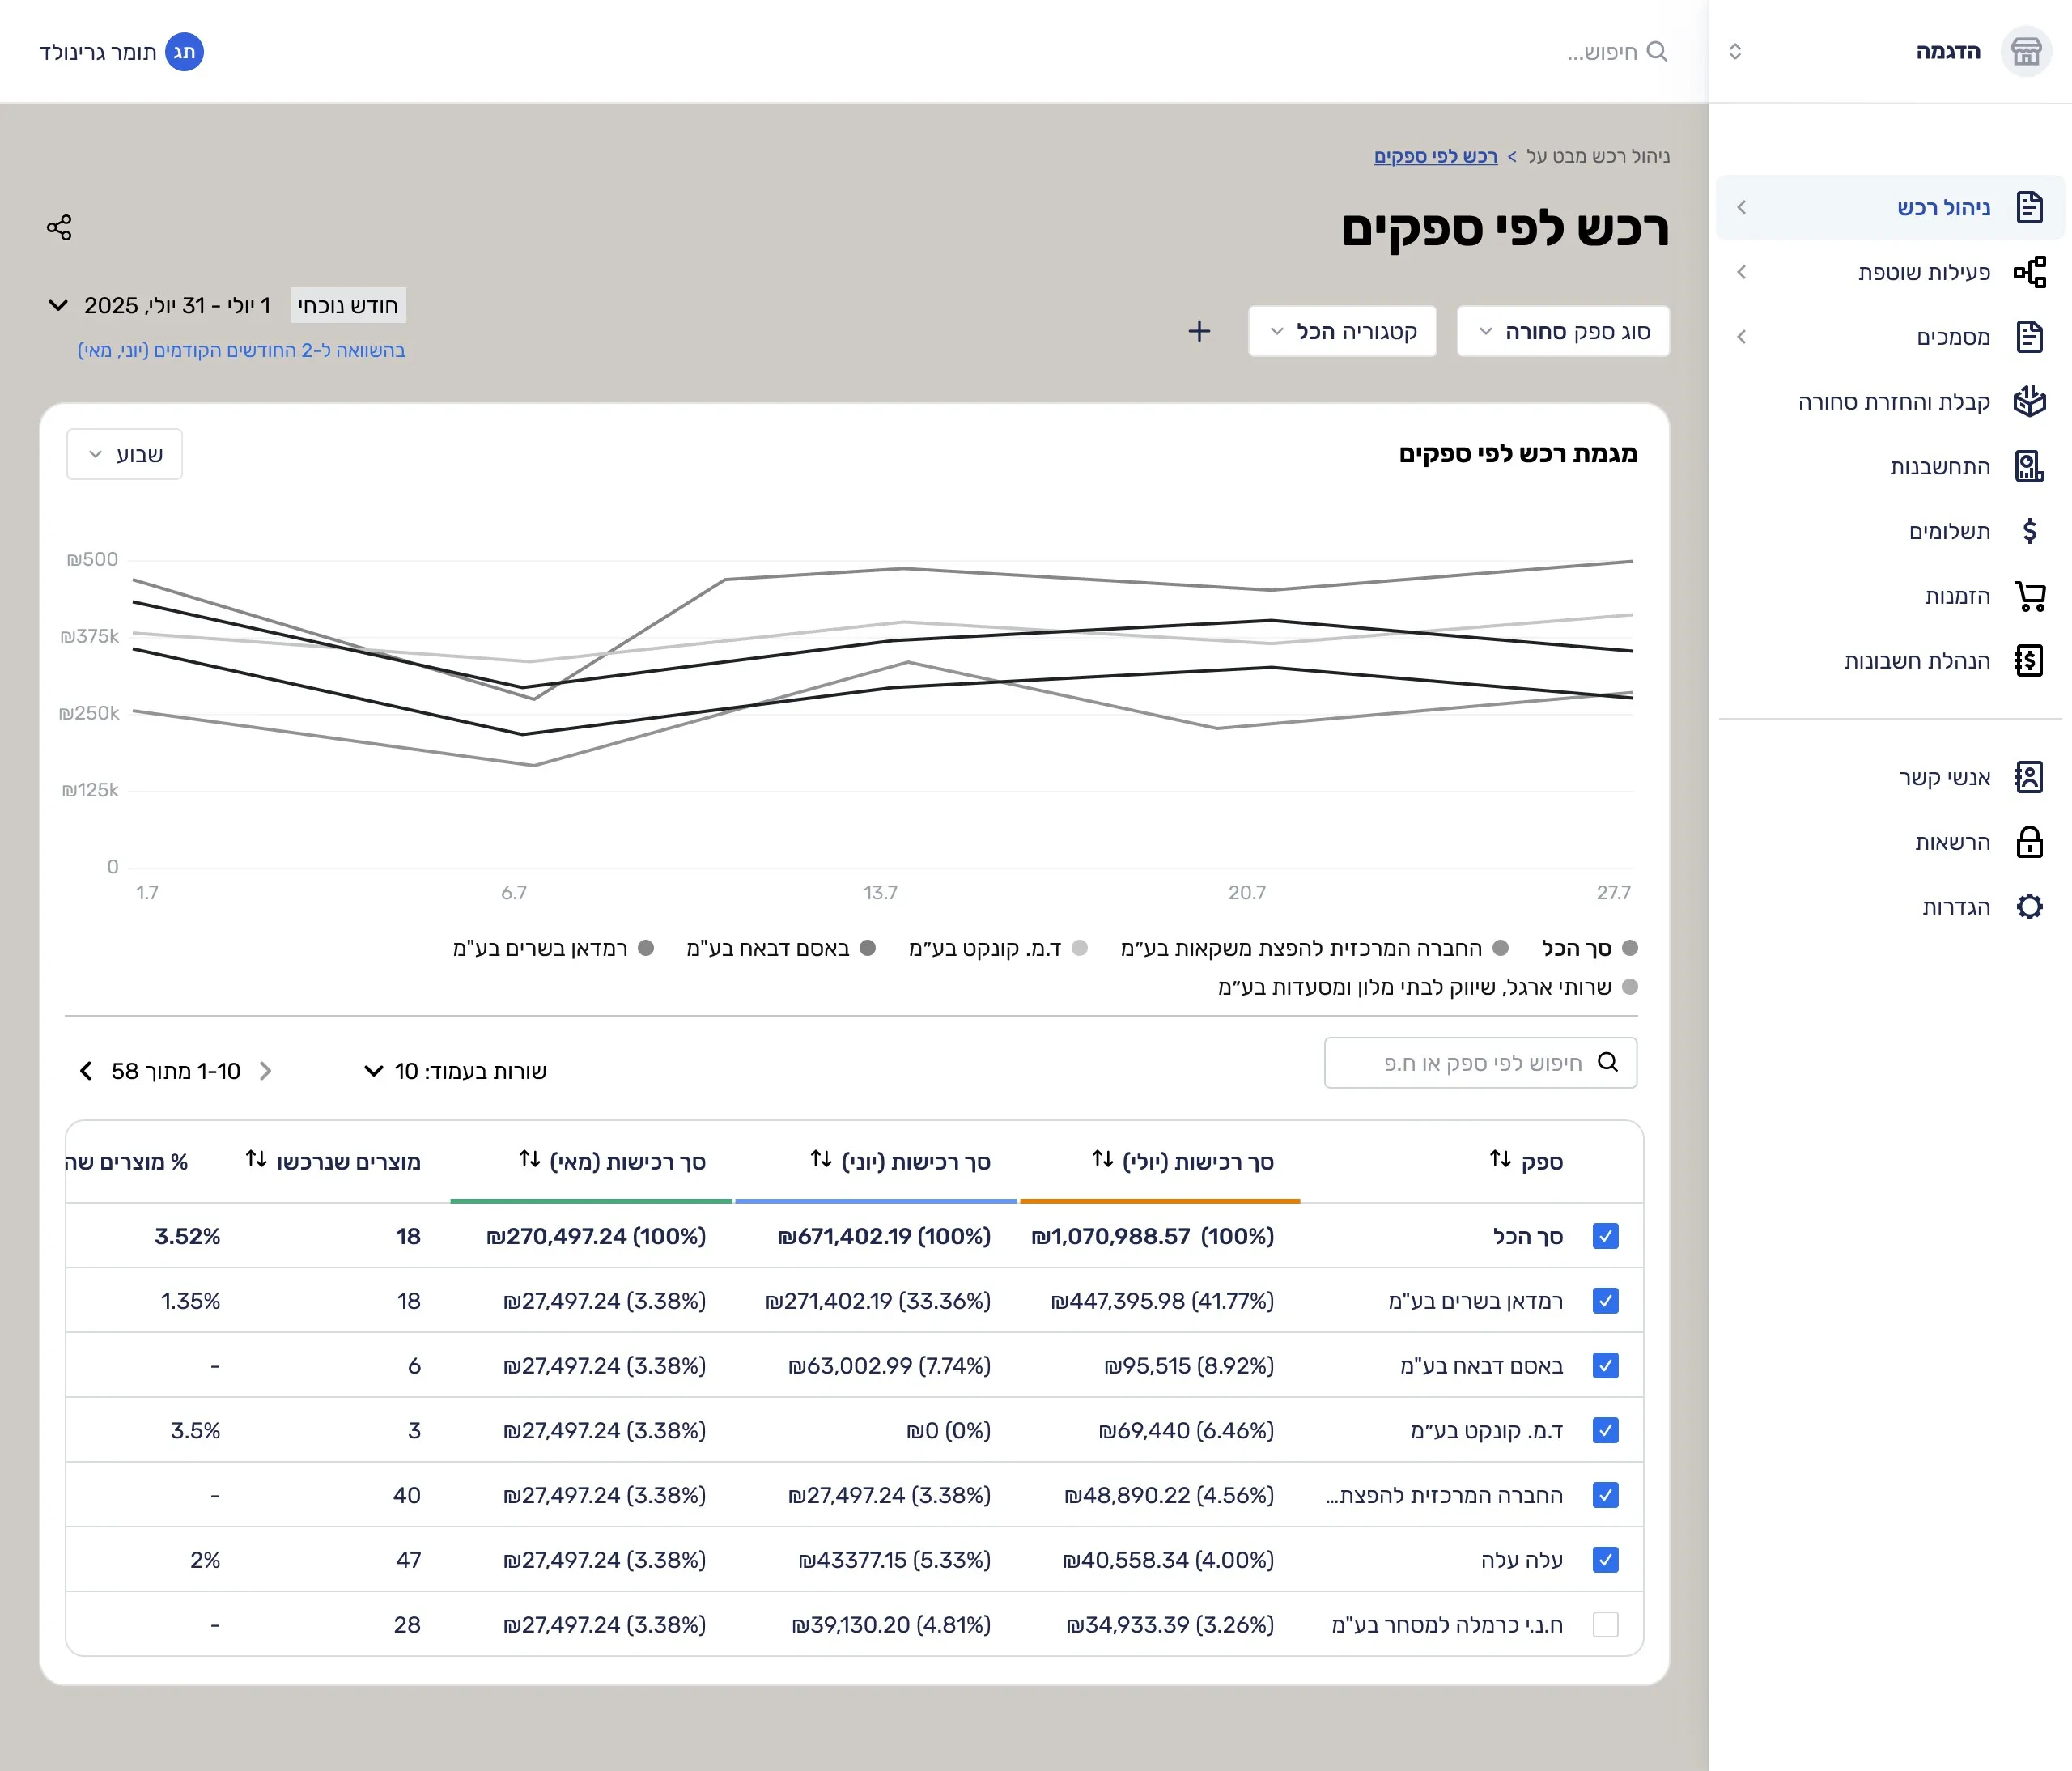
Detailed reports, insights in depth
Desktop version tailored for deep analysis and decision-making, with a mobile version for reviewing key report highlights on the go.
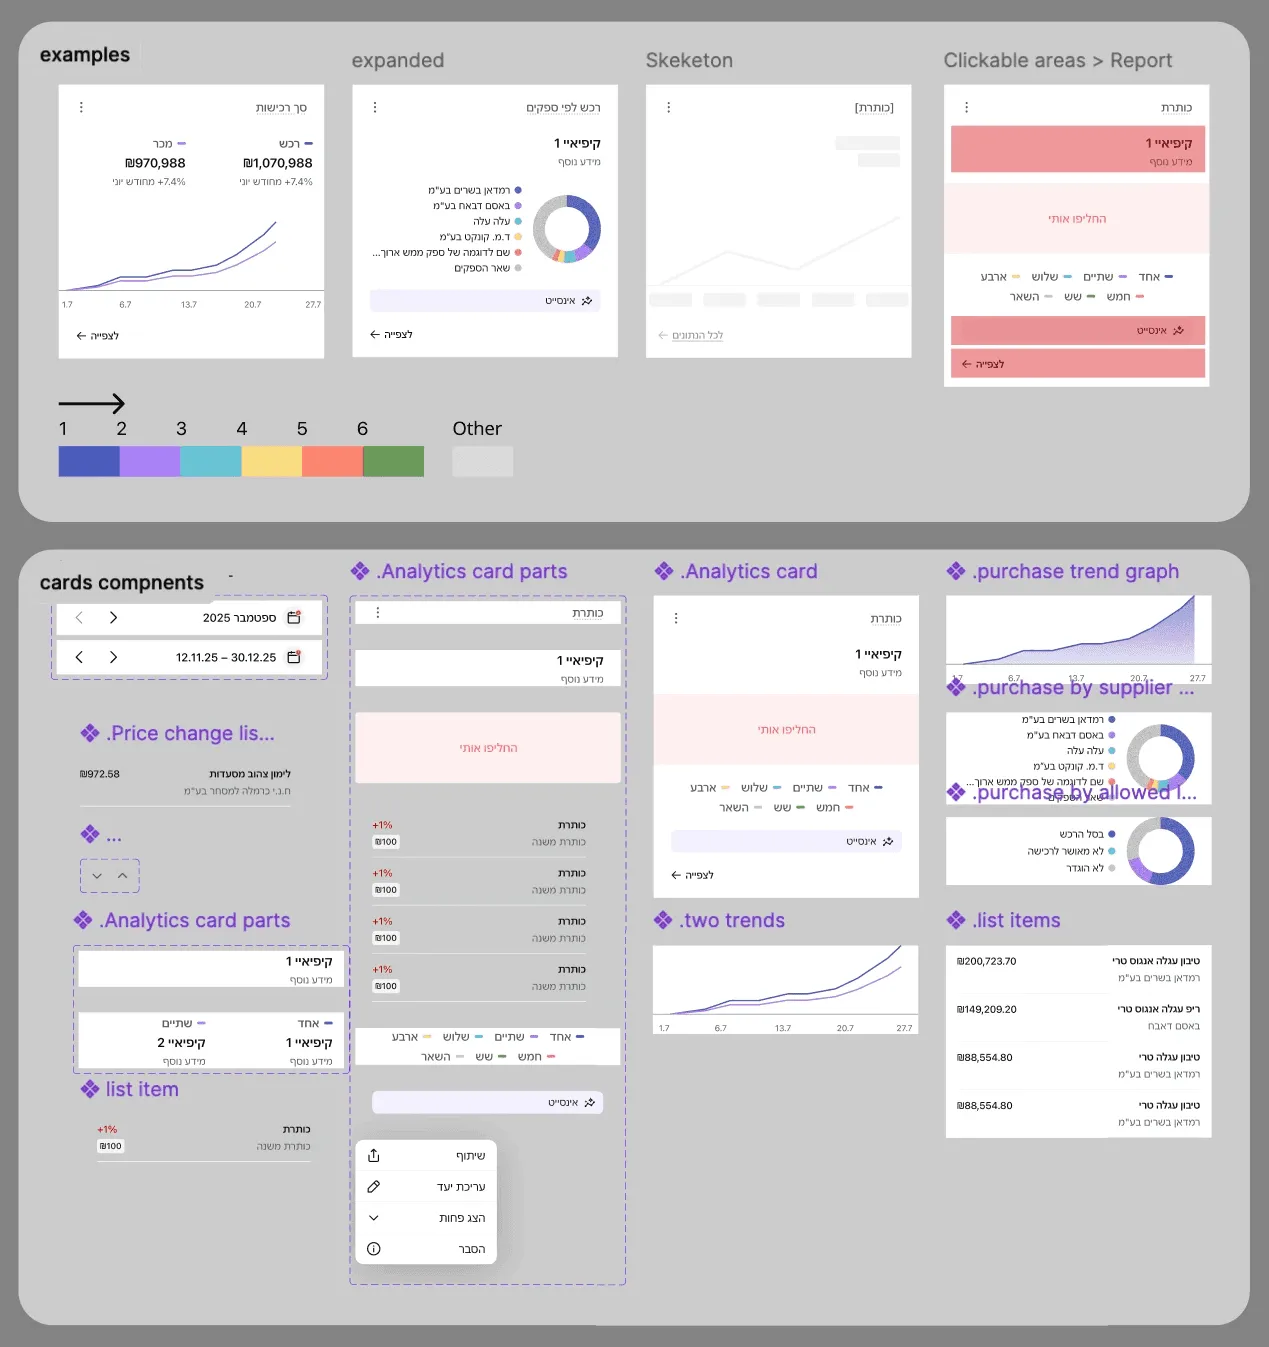
Build for Scale
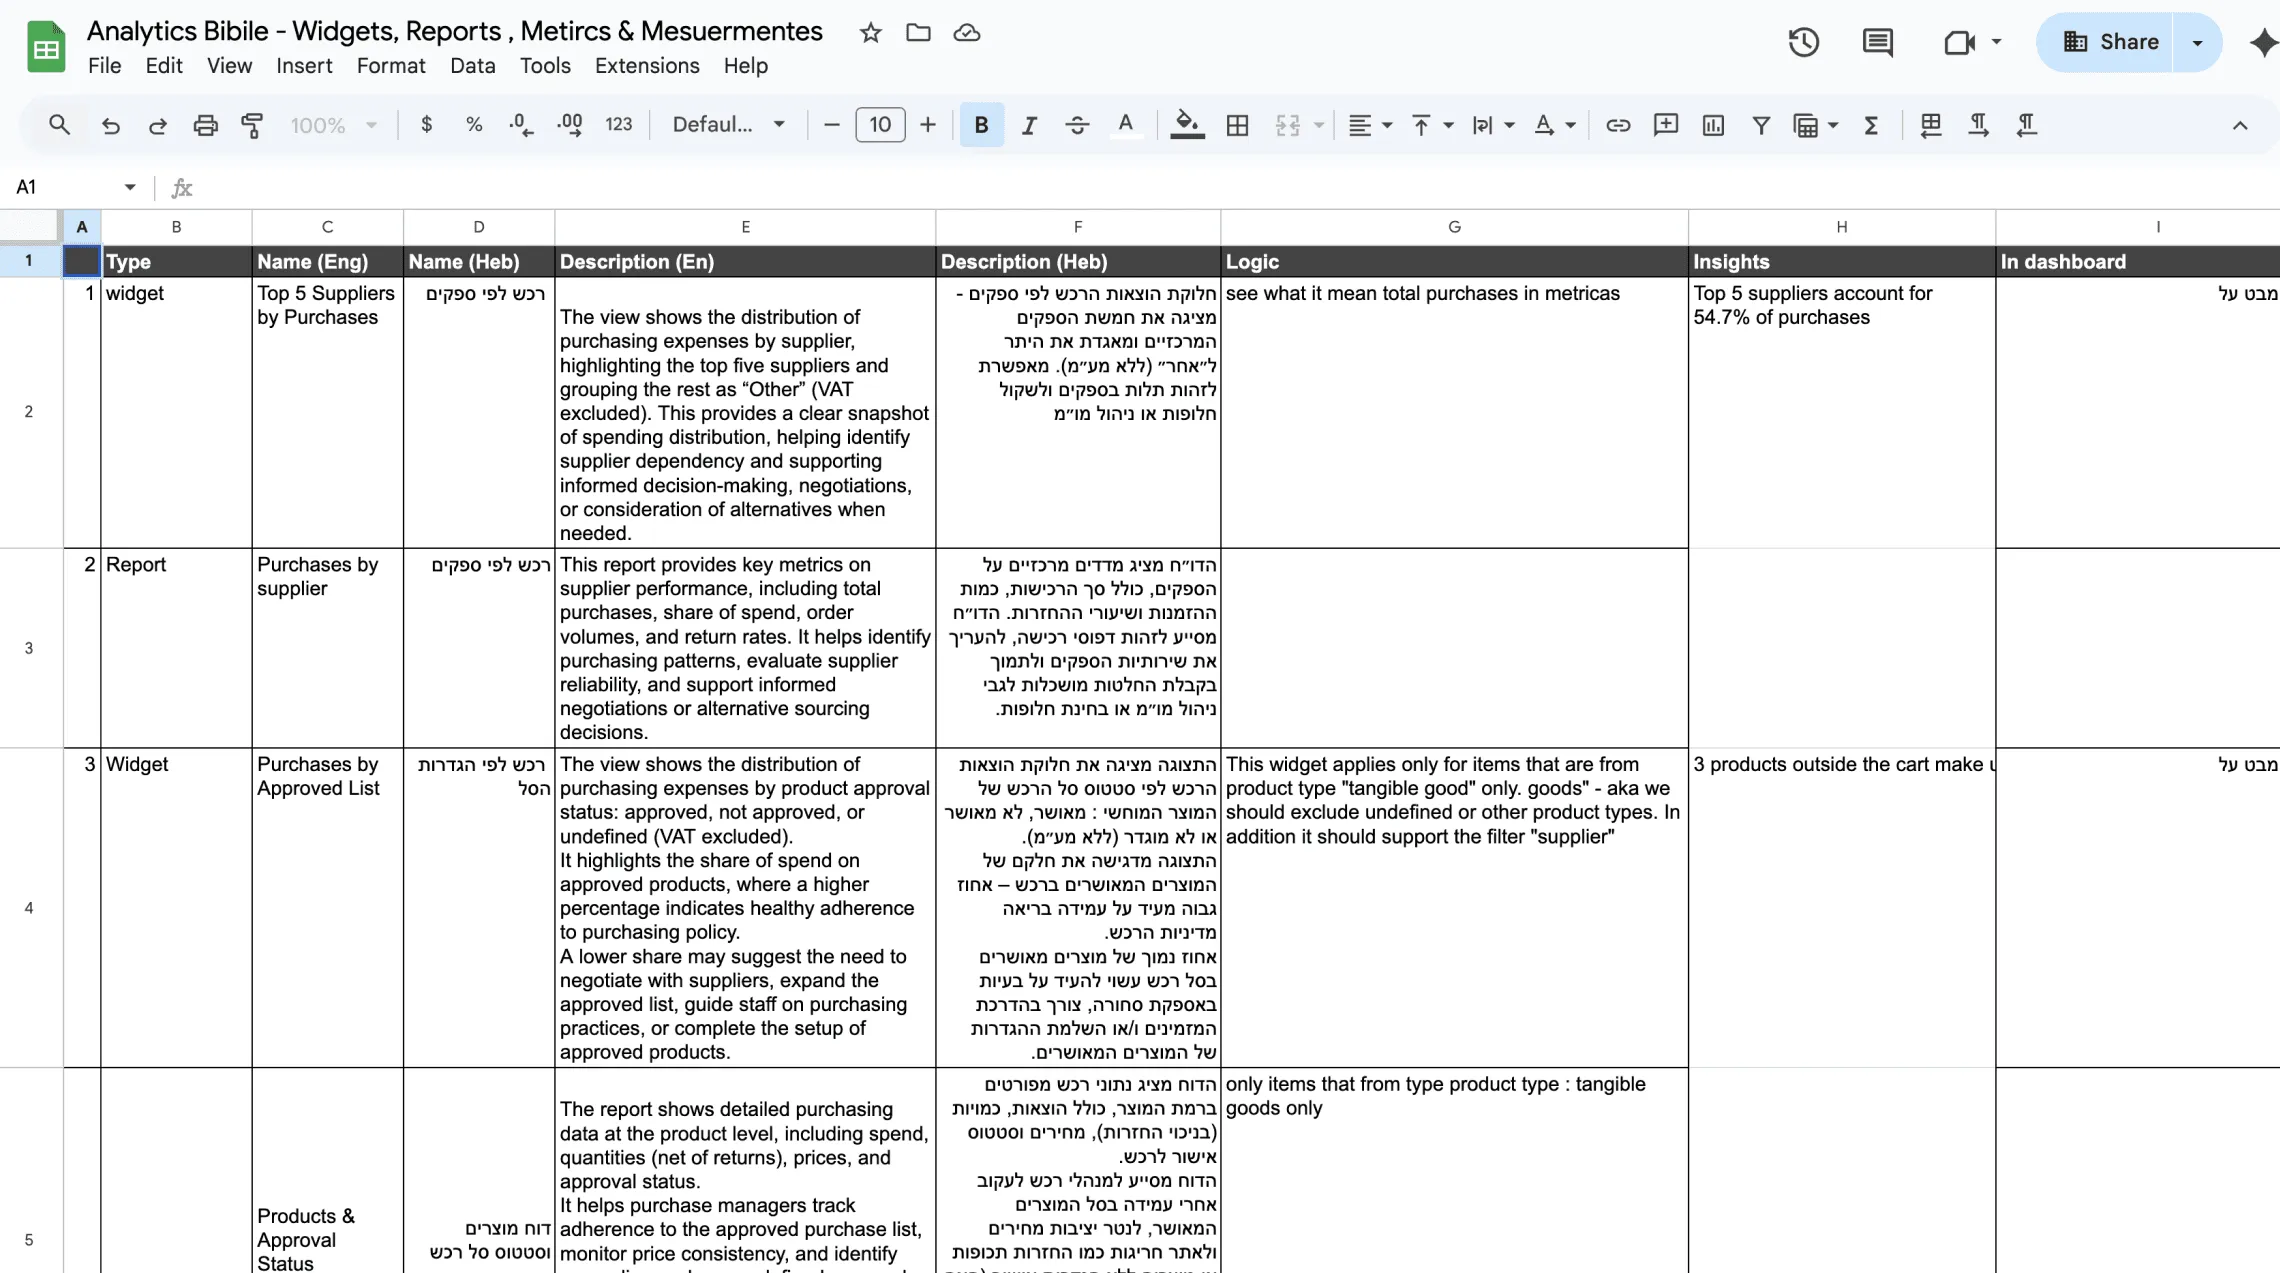
The widgets are built from a shared set of simple building blocks, so new cards can be created by reusing the same layouts, charts, and lists instead of designing each one again.
Validation
- I Used real production data to ground the design in actual behavior.
- Built a high‑fidelity prototype to simulate the final experience.
- Reviewed the flow with stakeholders and design partners.
- Collected qualitative feedback and used it to refine the solution.
Outcome
- Actionable insights with visual dashboards
- Centralized and organized information
- Self service reports
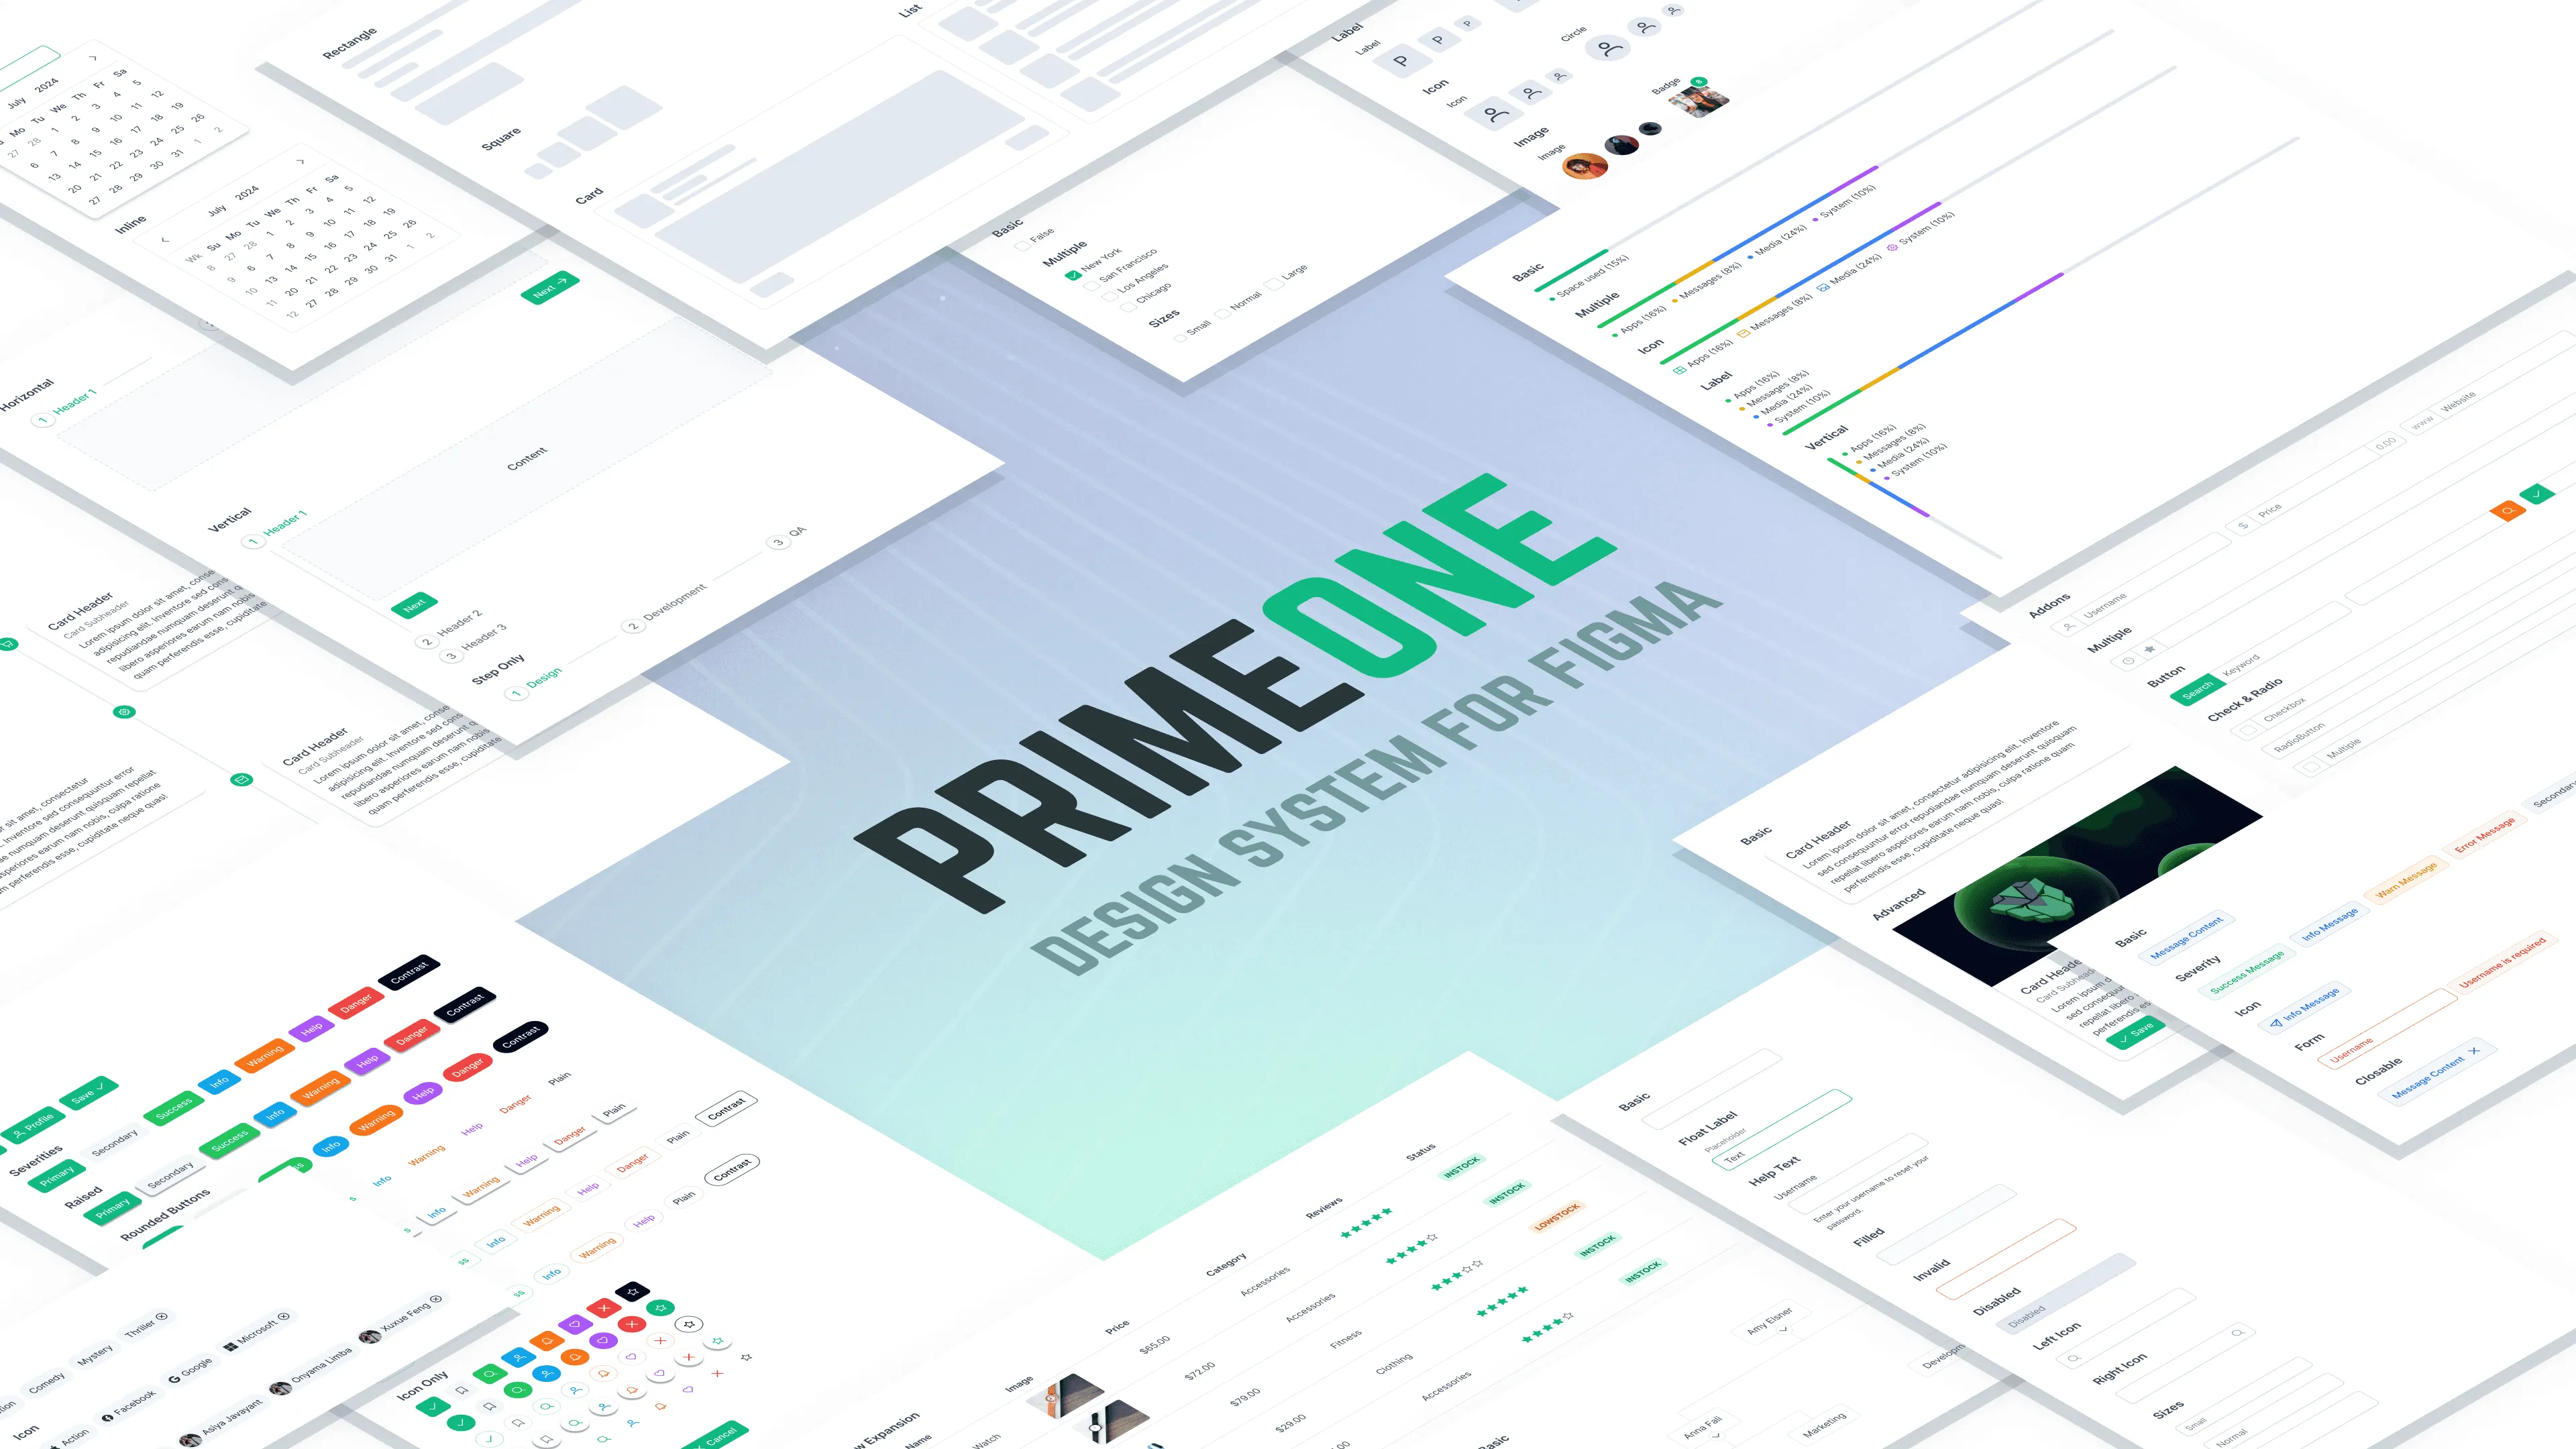
- Scalable Modern Design System based on PrimeVue